. 2006 Feb 22;25(4):798-810.
doi: 10.1038/sj.emboj.7600977. Epub 2006 Feb 9.

A hyper-dynamic equilibrium between promoter-bound and nucleoplasmic dimers controls NF-kappaB-dependent gene activity

Affiliations

A hyper-dynamic equilibrium between promoter-bound and nucleoplasmic dimers controls NF-kappaB-dependent gene activity

Daniela Bosisio et al. EMBO J. .

Abstract

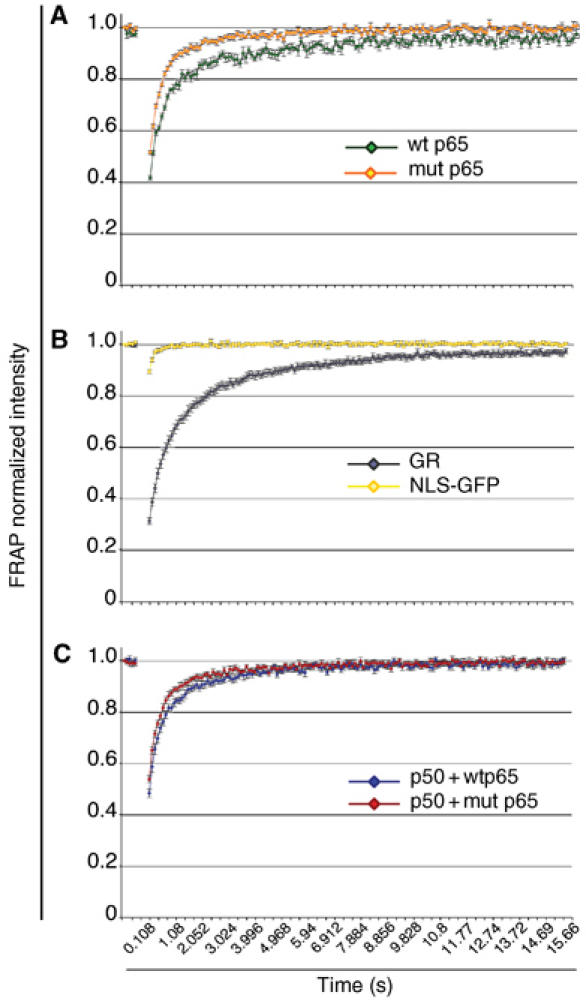
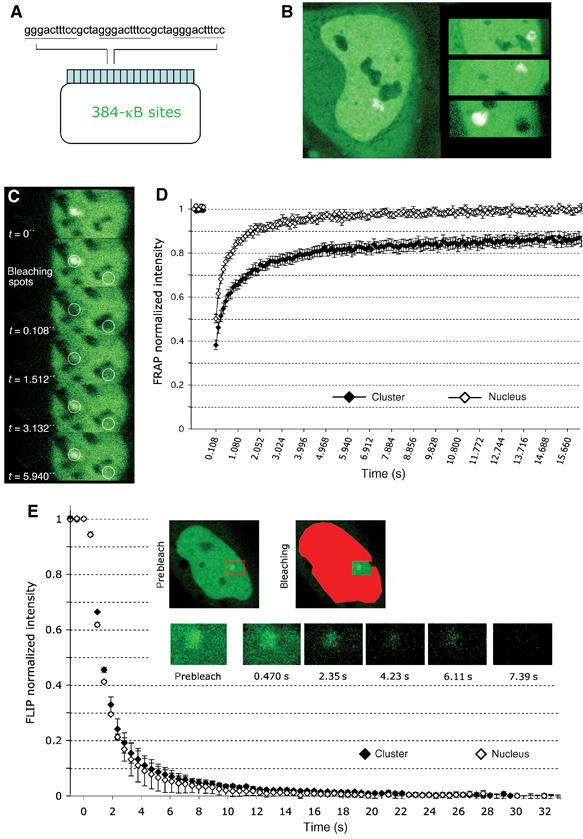
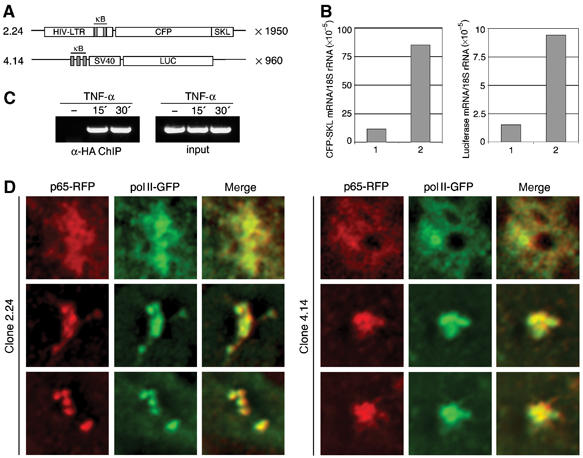
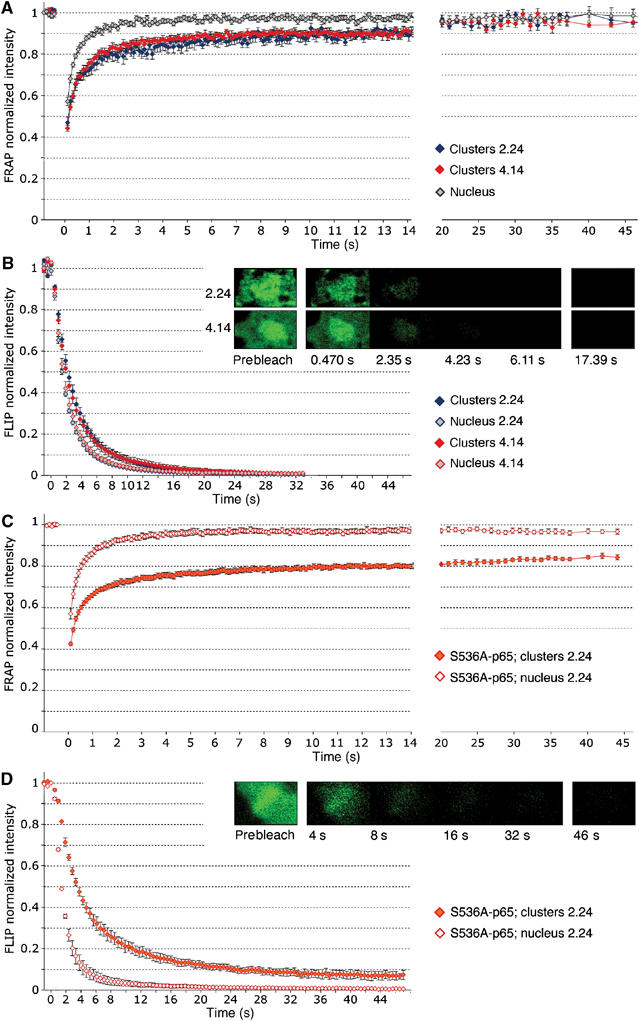
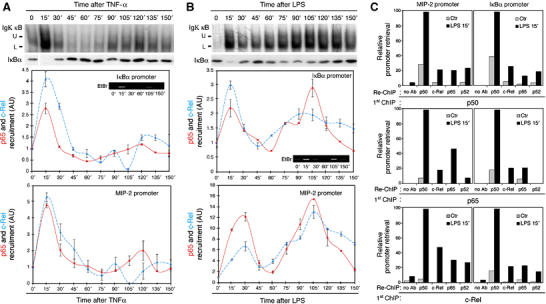
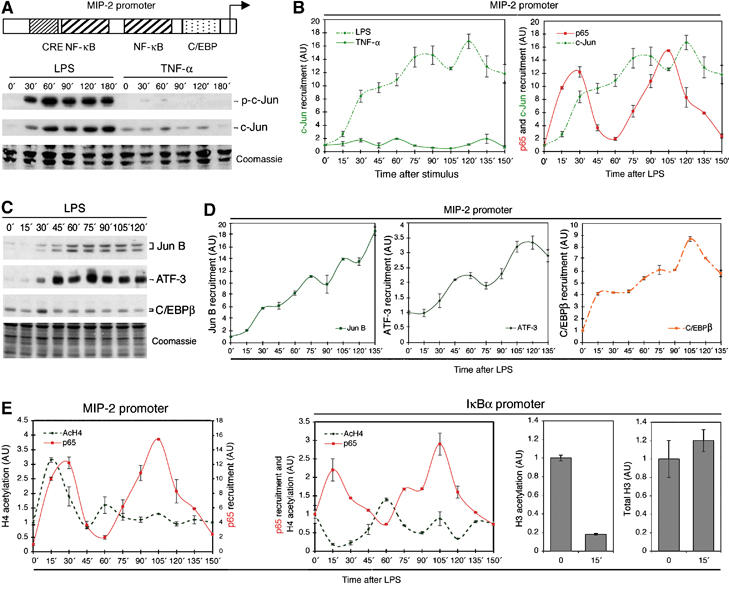
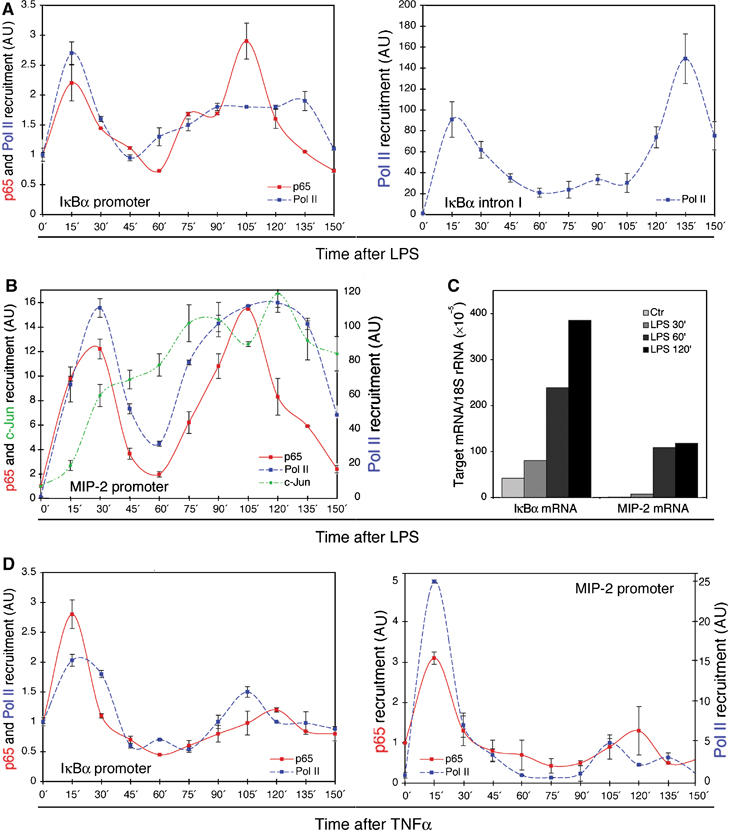
Because of its very high affinity for DNA, NF-kappaB is believed to make long-lasting contacts with cognate sites and to be essential for the nucleation of very stable enhanceosomes. However, the kinetic properties of NF-kappaB interaction with cognate sites in vivo are unknown. Here, we show that in living cells NF-kappaB is immobilized onto high-affinity binding sites only transiently, and that complete NF-kappaB turnover on active chromatin occurs in less than 30 s. Therefore, promoter-bound NF-kappaB is in dynamic equilibrium with nucleoplasmic dimers; promoter occupancy and transcriptional activity oscillate synchronously with nucleoplasmic NF-kappaB and independently of promoter occupancy by other sequence-specific transcription factors. These data indicate that changes in the nuclear concentration of NF-kappaB directly impact on promoter function and that promoters sample nucleoplasmic levels of NF-kappaB over a timescale of seconds, thus rapidly re-tuning their activity. We propose a revision of the enhanceosome concept in this dynamic framework.


Figures

Figure 1
Figure 1
Evaluation of p65/RelA nuclear mobility in living cells. All curves were averaged from 15 cells each; bars represent standard error. (A) FRAP analysis of GFP-wt p65 and of a GFP fusion with a mutant p65 that does not bind κB sites. GFP-p65 is cytoplasmic in >95% of HeLa cells before TNF treatment (data not shown). FRAP analysis was started 20 min after TNF stimulation. The difference between the wt and mutant p65-GFP curves is statistically highly significant (P<0.0001). (B) FRAP analysis of GFP-GR (in cells treated with dexamethasone for 20′) and of a nuclear GFP (NLS-GFP) (Bonaldi et al, 2003). (C) Quantitative analysis of FRAP in cells coexpressing p50 and GFP-wt p65 or GFP-mut p65. The difference between the two curves is significant (P<0.05) in the first 3 s.
Figure 2
Figure 2
NF-κB binding to high-affinity κB sites in living cells. (A) Schematic representation of the 384-κB construct, containing 128 repetitions of a basic unit of three tandem κB sites. (B) Visualization of an array of 384 κB sites in living cells. Cells bearing the 384-κB construct were cotransfected with p50 and GFP-p65, stimulated with TNF for 20 min, and viewed with a confocal microscope. Four representative nuclei (from different clones) are shown. (C) Selected FRAP images showing bleaching and recovery of one κB site array and a different area in the nucleus (encircled). (D) FRAP curves for p50/p65-GFP averaged from 15 nondescript areas in the nucleus (‘nucleus') and eight 384 κB site arrays (‘cluster'). Bars represent standard error. (E) FLIP analysis of NF-κB exchange on the κB site array. A representative nucleus is shown before and after the design of the bleach area (red). The image series shows the fluorescence loss from the array over time. FLIP curves (generated as described in Supplementary Figure S2) are averaged from seven 384 κB site arrays and 15 nondescript areas in the nucleus. Bars represent standard error. The difference between the two curves is statistically nonsignificant.
Figure 3
Figure 3
An array of transcriptionally functional NF-κB-regulated gene units. (A) Schematic representation of the NF-κB-regulated gene units amplified in clones 2.24 and 4.14. (B) NF-κB-dependent induction of CFP-SKL and luciferase mRNA. Clones 2.24 and 4.14 were transfected with p65 and left untreated (lanes ‘1') or stimulated with TNF-α for 1 h (lanes ‘2'). (C) Anti-HA-p65 ChIP on the HIV-LTR-CFP-SKL array. Clone 2.24 was transfected with HA-p65+p50 and stimulated with TNF-α for 15′ or 30′ as indicated. (D) Clones 2.24 and 4.14 were transfected with mRFP-p65 and GFP-rpbI; cells were stimulated with TNF for 30′ and analyzed in vitro. Details of representative nuclei are shown, in which the arrays display a different morphology.
Figure 4
Figure 4
Dynamics of NF-κB exchange on trascriptionally active chromatin. FRAP (A) and FLIP (B) curves on clone 2.24 (HIV-LTR) and 4.14 (synthetic gene). Curves are averaged from 10 clusters per type, and 20 nondescript areas in the nuclei (the two types of clones have been merged as there is no statistical difference between them). Bars represent standard error. The differences between the curves representing the two types of clusters are statistically nonsignificant, whereas the difference between any of the clusters and the rest of the nucleus is highly significant (P<0.001). In (B), the image series show the fluorescence loss over time at the cluster from one cell each of clones 2.24 and 4.14. FLIP curves are averaged from 10 cells each; bars represent standard error. The differences between the curves representing the two types of clusters are statistically nonsignificant, whereas the difference between any of the clusters and the rest of the nucleus is highly significant (P<0.002). (C) FRAP and (D) FLIP for S536A p65-GFP on the HIV-LTR cluster (clone 2.24). Curves are averaged from eight clusters and 10 nondescript areas in the nuclei; bars represent standard error.
Figure 5
Figure 5
Pulses of NF-κB activity and recruitment of NF-κB to target genes. (A, B) Upper panels: EMSAs showing NF-κB activity in TNF-α- and LPS-stimulated Raw264.7 cells, respectively. A canonical κB site was used as a probe. Kinetics of IκBα degradation and resynthesis are shown. Lower panels: ChIP assays were carried out with an anti-p65 (red) or an anti-c-Rel (light blue) antibody, and recruitment to the IκBα or MIP-2 genes was measured by Q-PCR. Conventional ChIPs migrated on EtBr-stained gels are shown in small insets. Data are from a duplicate experiment and are representative of three independent experiments with similar results. (C) Re-ChIPs were carried out using the indicated antibodies on unstimulated and LPS-stimulated (15′) Raw264.7 cell extracts. The chromatin immunoprecipitated in the first ChIP was divided into five aliquots and re-precipitated as indicated.
Figure 6
Figure 6
Recruitment of partner TFs to the MIP-2 gene promoter is dissociated from NF-κB occupancy. (A) Relative position of the κB, CRE and C/EBP sites in the MIP-2 promoter. Immunoblots of LPS and TNF-stimulated cells were probed with antibodies to phospho-Ser63 c-Jun or total c-Jun. A Coomassie staining of the filter is also shown. (B) Anti-c-Jun ChIPs in LPS and TNF-stimulated Raw264.7 cells. An overlay of p65/RelA (red) and c-Jun (green) recruitment curves in cells stimulated with LPS is shown on the right. (C) Immunoblots of LPS-stimulated Raw264.7 cells were probed with antibodies to JunB, ATF-3 or C/EBPβ. (D) Kinetics of JunB (left), ATF-3 (middle) and C/EBPβ (right) recruitment to the MIP2 promoter in LPS-stimulated Raw264.7 cells were assayed by ChIP followed by real-time PCR. (E) Dynamics of histone H4 acetylation (black) and p65 recruitment profiles (red) at the MIP-2 (left) and IκBα (right) gene promoters in LPS-stimulated Raw264.7 cells. Acetylated and total H3 levels are also shown.
Figure 7
Figure 7
Cycles of transcriptional activity parallel NF-κB recruitment pulses. (A) RNA Pol II recruitment to the IκBα gene promoter and intron 1 was assayed by anti-rpbI ChIP on extracts from LPS-stimulated Raw264.7 cells. p65 (red) and rpb1 (blue) recruitment curves on the IκBα promoter are overlaid (left). Please note y-axis scale differences. (B) RNA Pol II recruitment to the MIP-2 promoter. Curves were overlaid with p65 (red) and c-Jun (green) recruitment curves. (C) Quantitative mRNA analysis of IκBα and MIP-2 transcripts. (D) Kinetics of RNA Pol II recruitment (blue) to the IκBα and the MIP-2 promoters in TNF-stimulated cells, and overlay with the p65 recruitment curve (red).

Similar articles

Cited by

References

    1. Agresti A, Scaffidi P, Riva A, Caiolfa VR, Bianchi ME (2005) GR and HMGB1 interact only within chromatin and influence each other's residence time. Mol Cell 18: 109–121 - PubMed
    1. Ashburner BP, Westerheide SD, Baldwin AS Jr (2001) The p65 (RelA) subunit of NF-κB interacts with the histone deacetylase (HDAC) corepressors HDAC1 and HDAC2 to negatively regulate gene expression. Mol Cell Biol 21: 7065–7077 - PMC - PubMed
    1. Bonaldi T, Talamo F, Scaffidi P, Ferrera D, Porto A, Bachi A, Rubartelli A, Agresti A, Bianchi ME (2003) Monocytic cells hyperacetylate chromatin protein HMGB1 to redirect it towards secretion. EMBO J 22: 5551–5560 - PMC - PubMed
    1. Campbell RE, Tour O, Palmer AE, Steinbach PA, Baird GS, Zacharias DA, Tsien RY (2002) A monomeric red fluorescent protein. Proc Natl Acad Sci USA 99: 7877–7882 - PMC - PubMed
    1. Carey M (1998) The enhanceosome and transcriptional synergy. Cell 92: 5–8 - PubMed

Publication types