. 2006 Feb 8;26(6):1813-22.
doi: 10.1523/JNEUROSCI.4091-05.2006.

Integrins control dendritic spine plasticity in hippocampal neurons through NMDA receptor and Ca2+/calmodulin-dependent protein kinase II-mediated actin reorganization

Affiliations

Integrins control dendritic spine plasticity in hippocampal neurons through NMDA receptor and Ca2+/calmodulin-dependent protein kinase II-mediated actin reorganization

Yang Shi et al. J Neurosci. .

Abstract

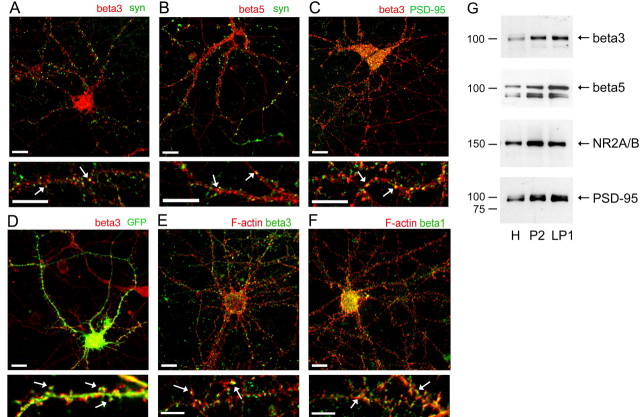
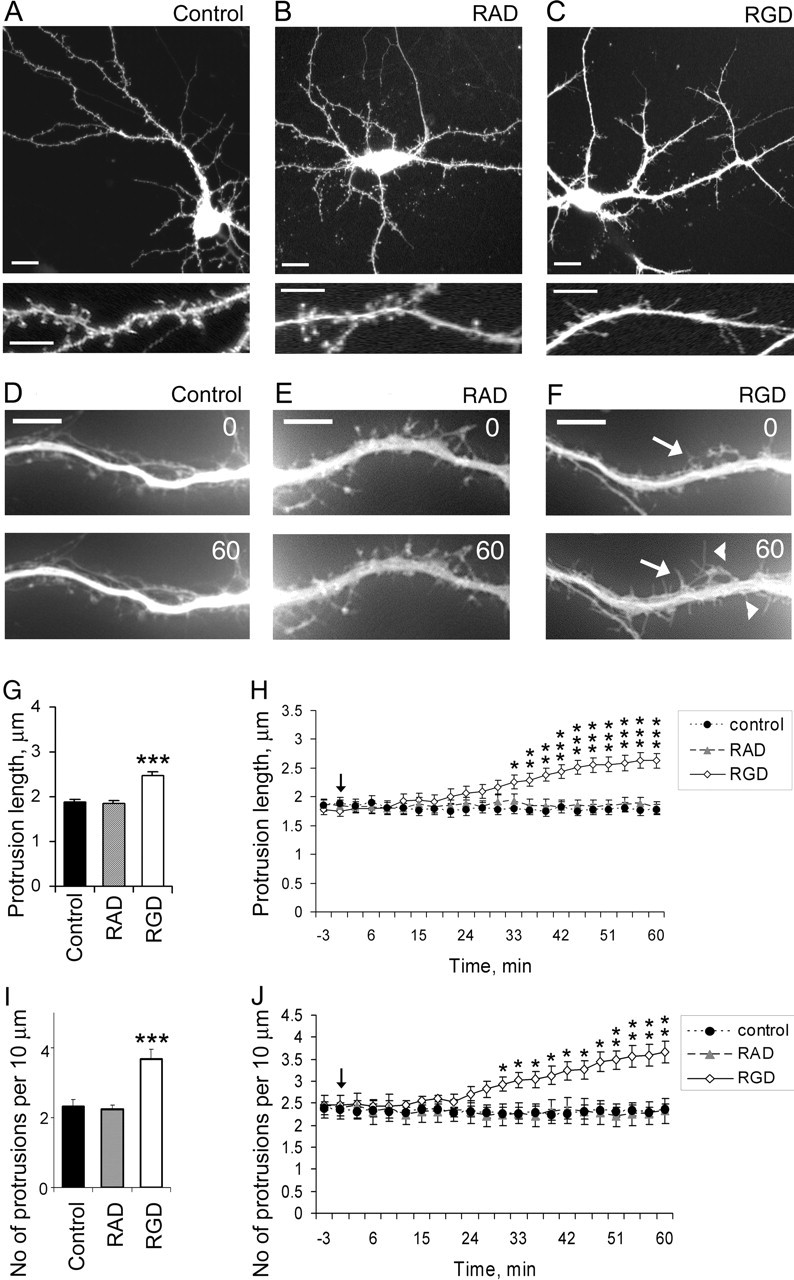
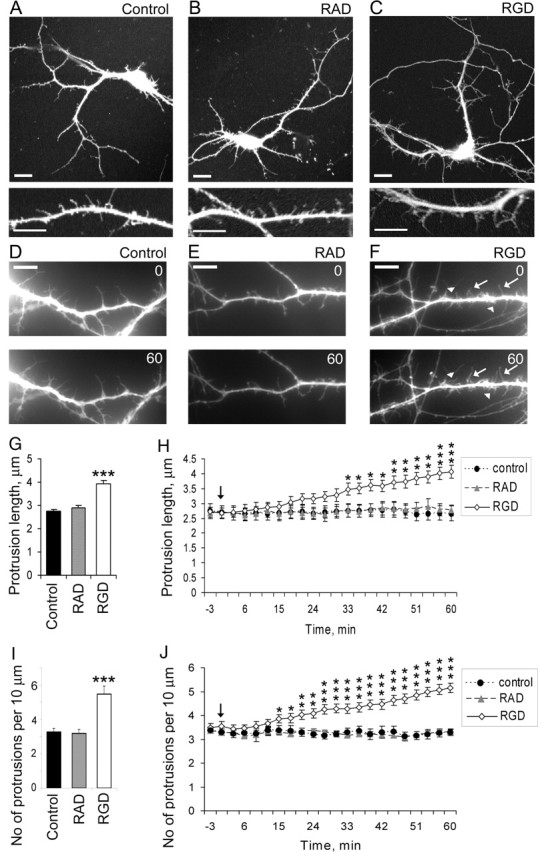
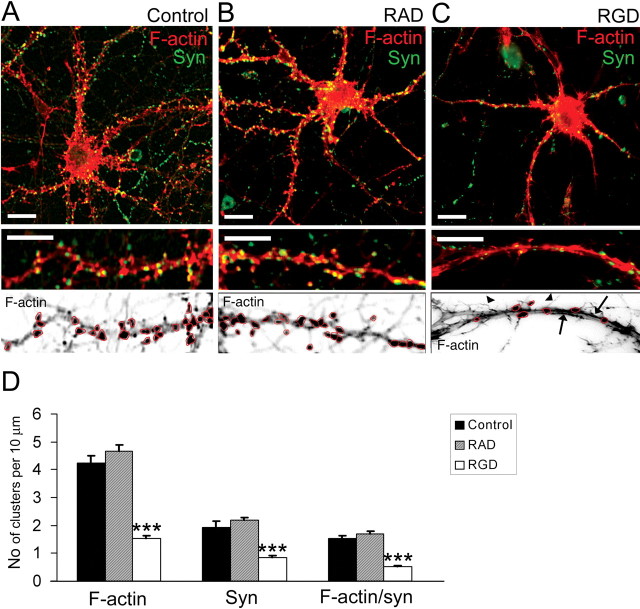
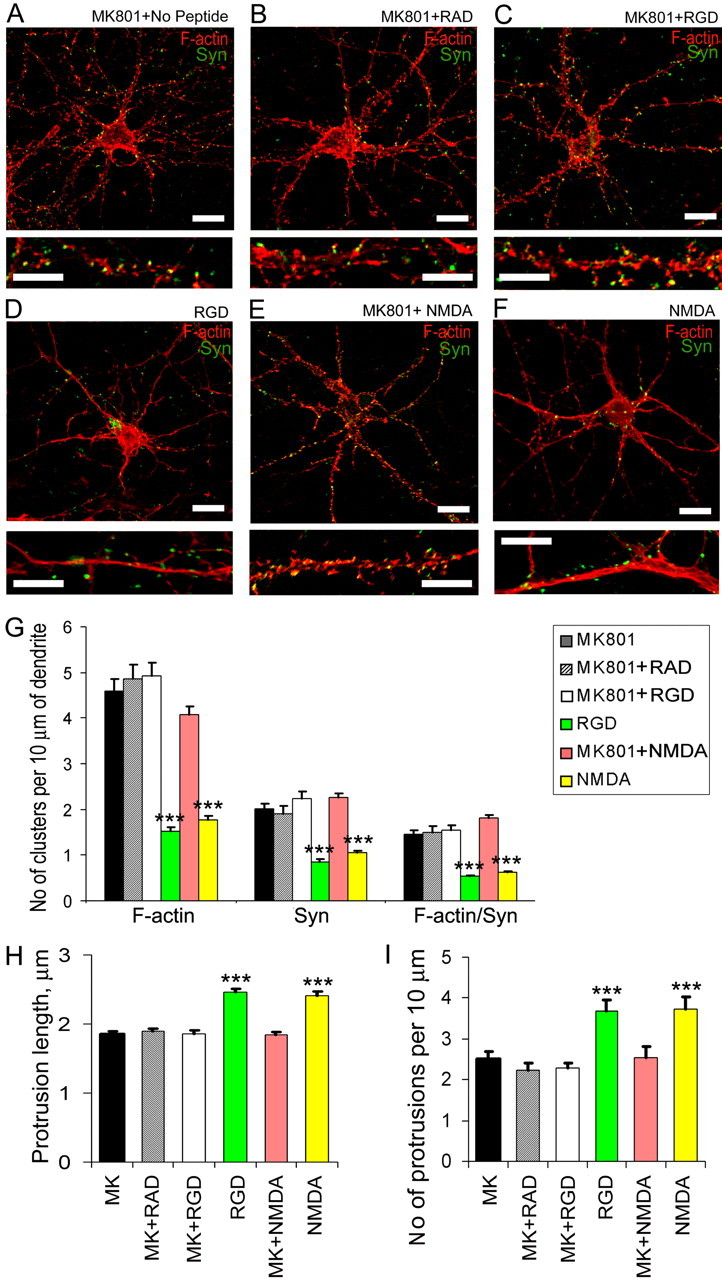
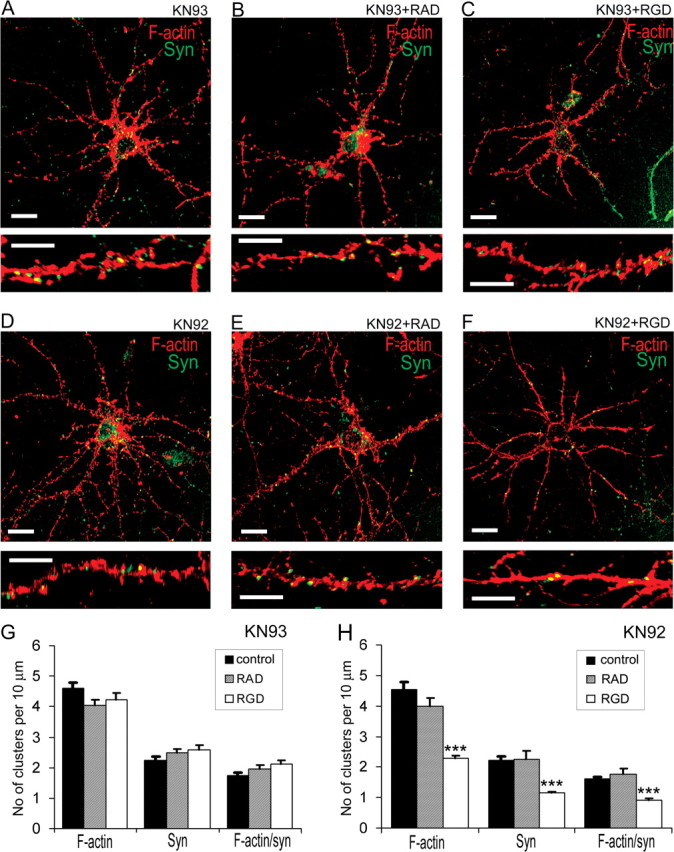
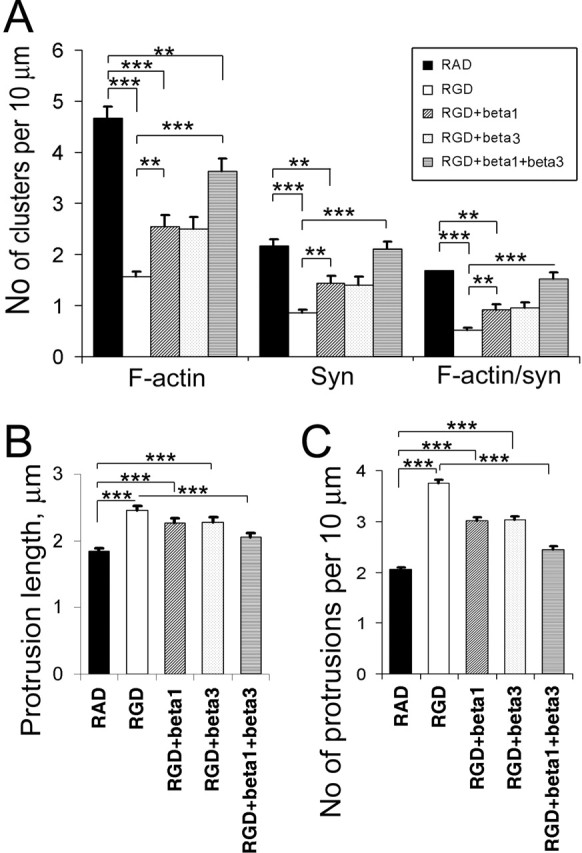
The formation of dendritic spines during development and their structural plasticity in the adult brain are critical aspects of synaptogenesis and synaptic plasticity. Many different factors and proteins have been shown to control dendritic spine development and remodeling (Ethell and Pasquale, 2005). The extracellular matrix (ECM) components and their cell surface receptors, integrins, have been found in the vicinity of synapses and shown to regulate synaptic efficacy and play an important role in long-term potentiation (Bahr et al., 1997; Chavis and Westbrook, 2001; Chan et al., 2003; Lin et al., 2003; Bernard-Trifilo et al., 2005). Although molecular mechanisms by which integrins affect synaptic efficacy have begun to emerge, their role in structural plasticity is poorly understood. Here, we show that integrins are involved in spine remodeling in cultured hippocampal neurons. The treatment of 14 d in vitro hippocampal neurons with arginine-glycine-aspartate (RGD)-containing peptide, an established integrin ligand, induced elongation of existing dendritic spines and promoted formation of new filopodia. These effects were also accompanied by integrin-dependent actin reorganization and synapse remodeling, which were partially inhibited by function-blocking antibodies against beta1 and beta3 integrins. This actin reorganization was blocked with the NMDA receptor (NMDAR) antagonist MK801 [(+)-5-methyl-10,11-dihydro-5H-dibenzo[a,d]cyclohepten-5,10-imine hydrogen maleate]. The Ca2+/calmodulin-dependent protein kinase II (CaMKII) inhibitor KN93 (N-[2-[N-(4-chlorocinnamyl)-N-methylaminomethyl]phenyl]-N-(2-hydroxyethyl)-4-methoxybenzenesulfonamide) also suppressed RGD-induced actin reorganization and synapse remodeling. Our findings show that integrins control ECM-mediated spine remodeling in hippocampal neurons through NMDAR/CaMKII-dependent actin reorganization.


Figures

Figure 1.
Figure 1.
Integrin subunits β1, β3, and β5 are localized in synapses of hippocampal neurons. A, B, Immunofluorescent labeling of 14 DIV hippocampal neurons showed localization of β3 (red; A) and β5 (red; B) in close proximity to synaptophysin-positive presynaptic boutons (green). Arrows indicate colocalization of integrins (red) and synaptophysin (green). Scale bars: top panel, 10 μm; bottom panel, 5 μm. C, Coimmunolabeling of β3 integrin clusters (red) and postsynaptic scaffold protein PSD-95 (green) in 14 DIV hippocampal neurons. β3-Immunopositive puncta (red) colocalized with PSD-95 (green). Arrows point to examples of synaptic integrin clusters. Scale bars: top panel, 10 μm; bottom panel, 5 μm. D, Immunofluorescent labeling of β3 integrin (red) in GFP-expressing 14 DIV hippocampal neurons. Hippocampal neurons were transfected with GFP at 5 DIV. At 14 DIV, hippocampal neurons were immunolabeled with anti-β3 integrin antibody. Arrows point to examples of β3 integrin clusters (red) that are localized in dendritic spines (green). Scale bars: top panel, 10 μm; bottom panel, 5 μm. E, F, Immunofluorescent labeling of 14 DIV hippocampal neurons shows localization of β3 (green; E) and β1 (green; F) in close proximity to polymerized actin (F-actin) that is labeled with rhodamine-coupled phalloidin (red). Arrows indicate colocalization of integrins (green) and F-actin (red). Scale bars: top panel, 10 μm; bottom panel, 5 μm. G, Western blot analysis of the subcellular distribution of β3 and β5 integrins in adult mouse hippocampus. Subcellular fractions were prepared from adult mouse hippocampus as described in Materials and Methods. Equal amounts (12 μg) of protein from each fraction were resolved on an 8–16% Tris-glycine gels and immunoblotted with specific antibodies against β3, β5, NR2A/B, and PSD-95. H, Homogenate; P2, crude synaptosome fraction; LP1, presynaptic and postsynaptic membrane fraction.
Figure 2.
Figure 2.
Dendritic spine elongation and new filopodia formation are induced by RGD-containing peptide in 14 DIV hippocampal neurons. A–C, Confocal images of GFP-labeled 14 DIV mouse hippocampal neurons untreated (A), treated with 500 μm control RAD-containing peptide (B), or treated with 500 μm RGD-containing peptide (C). GFP fluorescence was used to visualize dendritic morphology. RGD-treated neurons showed increased number of filopodia-like protrusions and increased length of dendritic spines, whereas neurons treated with control RAD-containing peptide showed no changes in dendritic spine morphology or length. Scale bars: top panel, 10 μm; bottom panel, 5 μm. D–F, Live images of GFP-labeled dendritic spines in 14 DIV hippocampal neurons before (0 min) and after (60 min) treatment with blank (D), control RAD (E), or RGD (F). RGD-treated neurons showed formation of new filopodia (arrowheads) and elongation of existing dendritic spines (arrows). G, H, Quantification of dendritic protrusion length in 14 DIV GFP-labeled hippocampal neurons before and after treatment with blank (control), control RAD, or RGD. G, Dendritic protrusions were significantly longer in RGD-treated neurons. Data represent the mean protrusion length. Error bars indicate SEM (n = 15 neurons per group). H, The time course of the elongation of dendritic protrusions showed a significant increase in mean protrusion length starting ∼30 min after RGD treatment. Live images were taken at 3 min intervals for 1 h. The arrow indicates RGD/RAD application. Data represent the mean protrusion length. Error bars indicate SEM (n = 5 neurons per group). *p < 0.05; **p < 0.01; ***p < 0.001 with one-way ANOVA. I, J, Quantification of dendritic protrusion density in 14 DIV GFP-labeled hippocampal neurons before and after treatment with blank (control), control RAD, or RGD. I, There were more dendritic protrusions in RGD-treated neurons. Data represent the average number of protrusions per 10 μm of dendrite. Error bars indicate SEM (n = 15 neurons per group). J, Time-lapse imaging has revealed a significant increase in the number of dendritic protrusion ∼30 min after RGD application. Live images were taken at 3 min interval for 1 h. The arrow indicates RGD/RAD application. Data represent the average number of protrusions per 10 μm of dendrite. Error bars indicate SEM (n = 5 neurons per group). *p < 0.05; **p < 0.01; ***p < 0.001 with one-way ANOVA.
Figure 3.
Figure 3.
RGD induced filopodia elongation and promoted new filopodia formation in 7 DIV hippocampal neurons. A–C, Confocal images of GFP-labeled 7 DIV mouse hippocampal neurons untreated (A), treated with 500 μm control RAD-containing peptide (B), or treated with 500 μm RGD-containing peptide (C). GFP fluorescence was used to visualize dendritic morphology. RGD-treated neurons showed increased length and number of filopodia-like protrusions, whereas neurons treated with control RAD-containing peptide showed no changes in dendritic filopodia number or length. Scale bars: top panel, 10 μm; bottom panel, 5 μm. D–F, Live images of GFP-labeled dendritic spines in 7 DIV hippocampal neurons before (0 min) and after (60 min) treatment with blank (D), control RAD (E), or RGD (F). RGD-treated neurons showed formation of new (arrowheads) and elongation of existing filopodia (arrows). G, H, Quantification of dendritic protrusion length in 7 DIV GFP-labeled hippocampal neurons before and after treatment with blank (control), control RAD, or RGD. G, Dendritic protrusions were significantly longer in RGD-treated neurons. Data represent the mean protrusion length. Error bars indicate SEM (n = 15 neurons per group). H, Time course of the elongation of dendritic protrusions showed a significant increase in mean protrusion length starting ∼20 min after RGD treatment. Live images were taken at 3 min intervals for 1 h. The arrow indicates RGD/RAD application. Data represent the mean protrusion length. Error bars indicate SEM (n = 5 neurons per group). *p < 0.05; **p < 0.01; ***p < 0.001 with one-way ANOVA. I, J, Quantification of dendritic protrusion density in 7 DIV GFP-labeled hippocampal neurons before and after treatment with blank (control), control RAD, or RGD. I, There were more dendritic protrusions in RGD-treated neurons. Data represent the average number of protrusions per 10 μm of dendrite. Error bars indicate SEM (n = 15 neurons per group). J, Time-lapse imaging revealed a significant increase in the number of dendritic protrusion ∼20 min after RGD application. Live images were taken at 3 min intervals for 1 h. The arrow indicates RGD/RAD application. Data represent the average number of protrusions per 10 μm of dendrite. Error bars indicate SEM (n = 5 neurons per group). *p < 0.05; **p < 0.01; ***p < 0.001 with one-way ANOVA.
Figure 4.
Figure 4.
RGD induced actin reorganization and synapse remodeling in 14 DIV hippocampal neurons. A–C, Confocal images of 14 DIV mouse hippocampal neurons untreated (A), or treated with 500 μm RAD-containing peptide (B) or with 500 μm RGD-containing peptide (C). Detection of polymerized F-actin with rhodamine-coupled phalloidin (red) and presynaptic boutons by synaptophysin immunostaining (green) is shown. Bottom panels show inverted fluorescent images of dendritic fragments with characteristic F-actin labeling for each group. Control untreated (A) or control RAD-treated (B) 14 DIV neurons demonstrated F-actin clusters in close proximity to synaptophysin-positive presynaptic boutons. RGD-treated (C) neurons showed a significant reduction in the number of F-actin puncta (circled), the appearance of hair-like extensions (arrowheads), and a decreased number of synaptophysin-positive terminals. Moreover, rope-like actin bundles were seen in the dendritic shaft of RGD-treated neurons (arrows). Scale bar: top panels, 10 μm; bottom panels, 5 μm. D, Quantitative analysis of the number of F-actin, synaptophysin, and actin/synaptophysin double-positive clusters per 10 μm of dendrite. RGD-treated neurons showed reduction in the number of F-actin clusters, synaptophysin-positive presynaptic boutons, and spiny synapses. Data represent the average number of clusters per 10 μm of dendrite. Error bars indicate SEM (n = 15 neurons per group). ***p < 0.001 with one-way ANOVA.
Figure 5.
Figure 5.
Blockade of NMDAR with MK801 prevented RGD-induced actin reorganization at synapses and dendritic spine remodeling. A–F, Confocal images of 14 DIV hippocampal neurons from cultures treated with MK801 (A), MK801 plus RAD (B), MK801 plus RGD (C), RGD (D), MK801 plus NMDA (E), or NMDA (F). Detection of polymerized F-actin with rhodamine-coupled phalloidin (red) and presynaptic boutons by synaptophysin immunostaining (green) is shown. NMDAR blockade with its antagonist MK-801 (10 μm) prevented both RGD-induced and NMDA-mediated actin rearrangements. Scale bar: top panels, 10 μm; bottom panels, 5 μm. G, Quantitative analysis of the number of F-actin, synaptophysin, and actin/synaptophysin double-positive clusters per 10 μm of dendrite. Treatment with MK801 blocked RGD-induced and NMDA-mediated reduction in the number of F-actin clusters, synaptophysin-positive presynaptic boutons, and spiny synapses. Data represent the average number of clusters per 10 μm of dendrite. Error bars indicate SEM (n = 10 neurons per group). ***p < 0.001 with one-way ANOVA. H, I, Quantification of dendritic protrusion length (H) and number (I) in 14 DIV GFP-labeled hippocampal neurons after treatment with MK801, MK801 plus RAD, MK801 plus RGD, RGD, MK801 plus NMDA, or NMDA. Treatment with MK801 blocked RGD-induced and NMDA-mediated dendritic spine elongation and new filopodia extension. Data represent the mean protrusion length (H) or average number of protrusions per 10 μm of dendrite (I). Error bars indicate SEM (n = 10 neurons per group). ***p < 0.001 by one-way ANOVA.
Figure 6.
Figure 6.
CaMKII inhibitor KN93 prevented the actin reorganization induced by RGD in 14 DIV hippocampal neurons. A–F, Confocal images of 14 DIV hippocampal neurons from cultures treated with KN93 (A), KN93 plus RAD (B), KN93 plus RGD (C), KN92 (D), KN92 plus RAD (E), or KN92 plus RGD (F). Detection of polymerized F-actin with rhodamine-coupled phalloidin (red) and presynaptic boutons by synaptophysin immunostaining (green) is shown. Pretreatment with CaMKII inhibitor KN93, but not its inactive homolog KN92, blocked RGD-induced actin reorganization. G, H, Quantitative analysis of the number of F-actin, synaptophysin, and actin/synaptophysin double-positive clusters per 10 μm of dendrite. Treatments with KN93 (G), but not KN92 (H), blocked RGD-induced reduction in the number of F-actin clusters, synaptophysin-positive presynaptic boutons, and spiny synapses. Data represent the average number of clusters per 10 μm of dendrite. Error bars indicate SEM (n = 10 neurons per group). ***p < 0.001 with one-way ANOVA.
Figure 7.
Figure 7.
Function-blocking antibodies against β1 and β3 integrin partially blocked RGD-induced actin reorganization and dendritic spine elongation. A, Quantitative analysis of the number of F-actin, synaptophysin, and actin/synaptophysin double-positive clusters per 10 μm of dendrite. Data represent the average number of clusters per 10 μm of dendrite. Error bars indicate SEM (n = 10 neurons per group). **p < 0.01; ***p < 0.001 by one-way ANOVA. B, C, Quantification of dendritic protrusion length (B) and number (C) in 14 DIV GFP-labeled hippocampal neurons after treatment with RAD, RGD, RGD plus anti-β1 antibody, RGD plus anti-β3 antibody, or RGD plus anti-β1 and anti-β3 antibodies. Data represent the mean protrusion length (B) or average number of protrusions per 10 μm of dendrite (C). Error bars indicate SEM (n = 10 neurons per group). ***p < 0.001 by one-way ANOVA.

Similar articles

Cited by

References

    1. Aplin AE, Howe A, Alahari SK, Juliano RL (1998). Signal transduction and signal modulation by cell adhesion receptors: the role of integrins, cadherins, immunoglobulin-cell adhesion molecules, and selectins. Pharmacol Rev 50:197–263. - PubMed
    1. Bahr BA, Staubli U, Xiao P, Chun D, Ji ZX, Esteban ET, Lynch G (1997). Arg-Gly-Asp-Ser-selective adhesion and the stabilization of long-term potentiation: pharmacological studies and the characterization of a candidate matrix receptor. J Neurosci 17:1320–1329. - PMC - PubMed
    1. Bernard-Trifilo JA, Kramar EA, Torp R, Lin CY, Pineda EA, Lynch G, Gall CM (2005). Integrin signaling cascades are operational in adult hippocampal synapses and modulate NMDA receptor physiology. J Neurochem 93:834–849. - PubMed
    1. Bi X, Lynch G, Zhou J, Gall CM (2001). Polarized distribution of alpha5 integrin in dendrites of hippocampal and cortical neurons. J Comp Neurol 435:184–193. - PubMed
    1. Blystone SD (2002). Kinetic regulation of beta 3 integrin tyrosine phosphorylation. J Biol Chem 277:46886–46890. - PubMed

Publication types

MeSH terms