

Pol II-expressed shRNA knocks down Sod2 gene expression and causes phenotypes of the gene knockout in mice
- PMID: 16450009
- PMCID: PMC1358942
- DOI: 10.1371/journal.pgen.0020010
Pol II-expressed shRNA knocks down Sod2 gene expression and causes phenotypes of the gene knockout in mice
Abstract
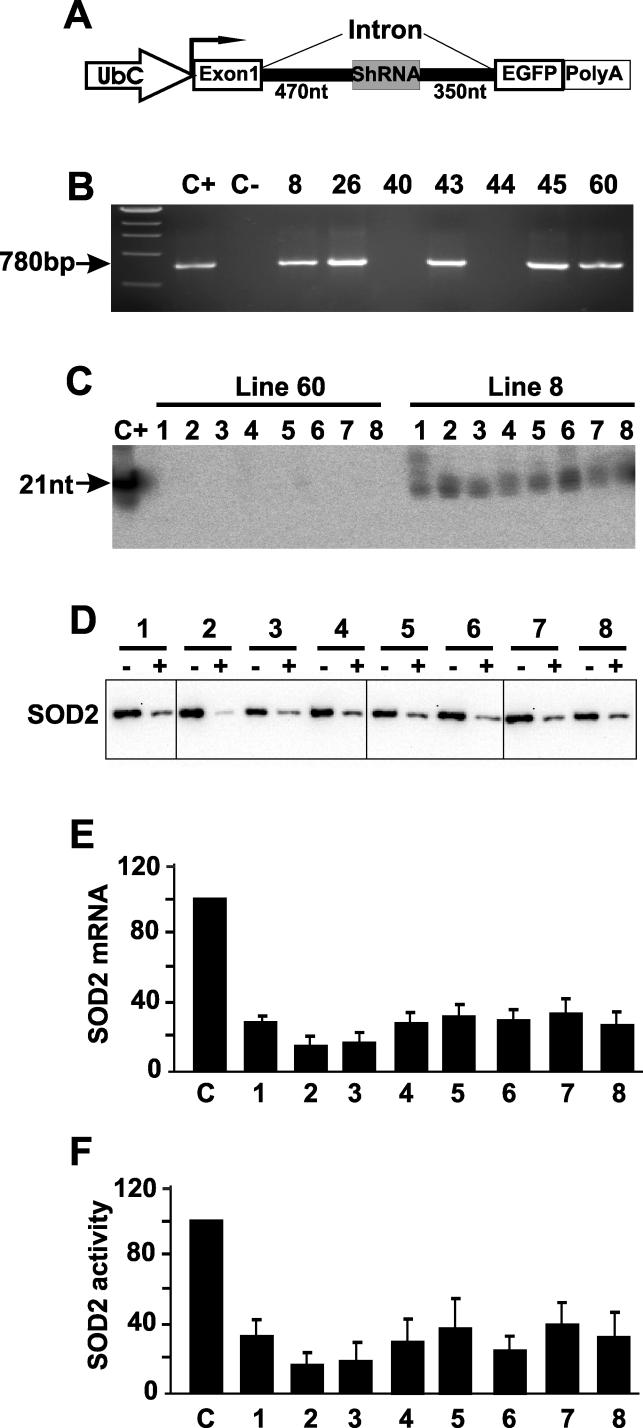
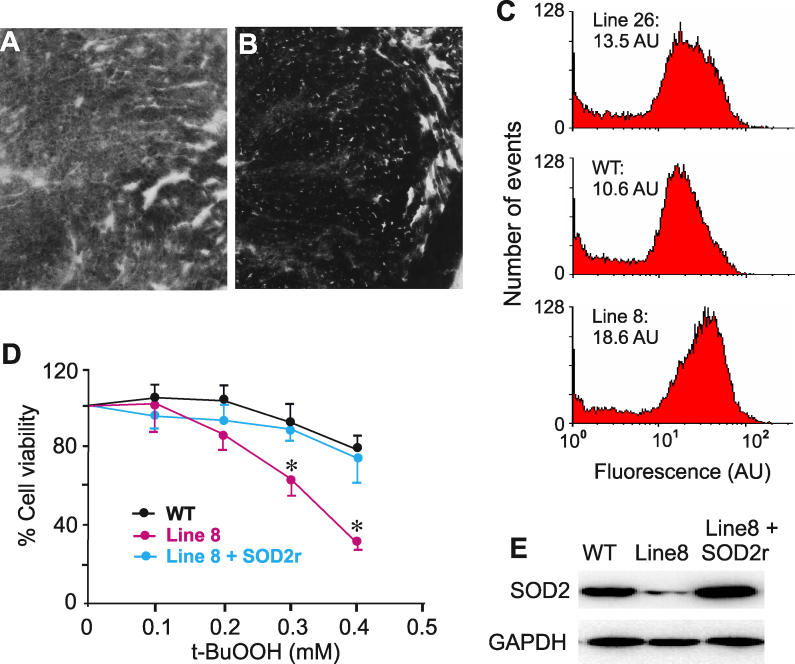
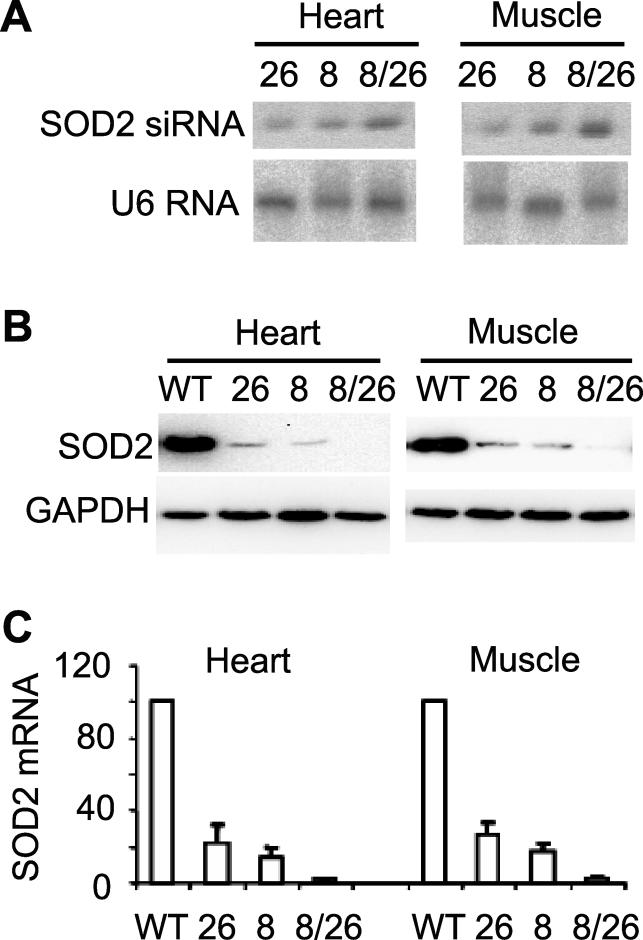
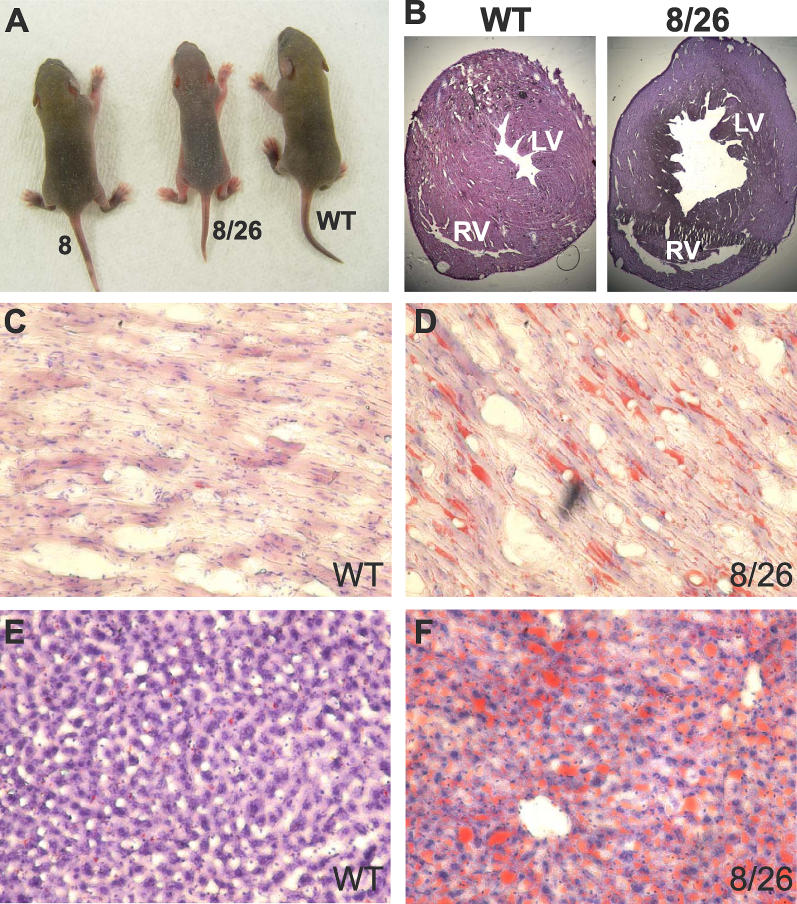
RNA interference (RNAi) has been used increasingly for reverse genetics in invertebrates and mammalian cells, and has the potential to become an alternative to gene knockout technology in mammals. Thus far, only RNA polymerase III (Pol III)-expressed short hairpin RNA (shRNA) has been used to make shRNA-expressing transgenic mice. However, widespread knockdown and induction of phenotypes of gene knockout in postnatal mice have not been demonstrated. Previous studies have shown that Pol II synthesizes micro RNAs (miRNAs)-the endogenous shRNAs that carry out gene silencing function. To achieve efficient gene knockdown in mammals and to generate phenotypes of gene knockout, we designed a construct in which a Pol II (ubiquitin C) promoter drove the expression of an shRNA with a structure that mimics human miRNA miR-30a. Two transgenic lines showed widespread and sustained shRNA expression, and efficient knockdown of the target gene Sod2. These mice were viable but with phenotypes of SOD2 deficiency. Bigenic heterozygous mice generated by crossing these two lines showed nearly undetectable target gene expression and phenotypes consistent with the target gene knockout, including slow growth, fatty liver, dilated cardiomyopathy, and premature death. This approach opens the door of RNAi to a wide array of well-established Pol II transgenic strategies and offers a technically simpler, cheaper, and quicker alternative to gene knockout by homologous recombination for reverse genetics in mice and other mammalian species.
Conflict of interest statement
Competing interests. XGX, HZ, and ZX are authors of a pending patent on the Pol II–shRNA construct used in this study.
Figures
Similar articles
-
An RNA polymerase II construct synthesizes short-hairpin RNA with a quantitative indicator and mediates highly efficient RNAi.Nucleic Acids Res. 2005 Apr 1;33(6):e62. doi: 10.1093/nar/gni061. Nucleic Acids Res. 2005. PMID: 15805121 Free PMC article.
-
Construction of simple and efficient DNA vector-based short hairpin RNA expression systems for specific gene silencing in mammalian cells.Methods Mol Biol. 2007;408:223-41. doi: 10.1007/978-1-59745-547-3_13. Methods Mol Biol. 2007. PMID: 18314586
-
Production of transgenic pigs that express porcine endogenous retrovirus small interfering RNAs.Xenotransplantation. 2009 May-Jun;16(3):164-80. doi: 10.1111/j.1399-3089.2009.00525.x. Xenotransplantation. 2009. PMID: 19566656
-
Transgenic RNAi: Accelerating and expanding reverse genetics in mammals.Transgenic Res. 2006 Jun;15(3):271-5. doi: 10.1007/s11248-006-0023-2. Transgenic Res. 2006. PMID: 16779643 Review.
-
Approaches for chemically synthesized siRNA and vector-mediated RNAi.FEBS Lett. 2005 Oct 31;579(26):5974-81. doi: 10.1016/j.febslet.2005.08.070. Epub 2005 Sep 20. FEBS Lett. 2005. PMID: 16199038 Review.
Cited by
-
Synthetic microRNA-mediated downregulation of Nogo-A in transgenic rats reveals its role as regulator of synaptic plasticity and cognitive function.Proc Natl Acad Sci U S A. 2013 Apr 16;110(16):6583-8. doi: 10.1073/pnas.1217665110. Epub 2013 Apr 1. Proc Natl Acad Sci U S A. 2013. PMID: 23576723 Free PMC article.
-
Developing tTA transgenic rats for inducible and reversible gene expression.Int J Biol Sci. 2009;5(2):171-81. doi: 10.7150/ijbs.5.171. Epub 2009 Jan 29. Int J Biol Sci. 2009. PMID: 19214245 Free PMC article.
-
Neutrophil-selective CD18 silencing using RNA interference in vivo.Blood. 2008 Apr 1;111(7):3591-8. doi: 10.1182/blood-2007-12-127837. Epub 2008 Jan 23. Blood. 2008. PMID: 18216298 Free PMC article.
-
Combinatorial RNAi: a winning strategy for the race against evolving targets?Mol Ther. 2007 May;15(5):878-88. doi: 10.1038/sj.mt.6300116. Epub 2007 Feb 20. Mol Ther. 2007. PMID: 17311009 Free PMC article. Review.
-
Heritable and stable gene knockdown in rats.Proc Natl Acad Sci U S A. 2006 Jul 25;103(30):11246-51. doi: 10.1073/pnas.0604657103. Epub 2006 Jul 14. Proc Natl Acad Sci U S A. 2006. PMID: 16844779 Free PMC article.
References
-
- Hannon GJ, Rossi JJ. Unlocking the potential of the human genome with RNA interference. Nature. 2004;431:371–378. - PubMed
-
- Mello CC, Conte D. Revealing the world of RNA interference. Nature. 2004;431:338–342. - PubMed
-
- Fire A, Xu S, Montgomery MK, Kostas SA, Driver SE, et al. Potent and specific genetic interference by double-stranded RNA in Caenorhabditis elegans . Nature. 1998;391:806–811. - PubMed
-
- Tomari Y, Zamore PD. Perspective: Machines for RNAi. Genes Dev. 2005;19:517–529. - PubMed
Publication types
MeSH terms
Substances
Grants and funding
LinkOut - more resources
Full Text Sources
Other Literature Sources
Molecular Biology Databases
