

A systematic model to predict transcriptional regulatory mechanisms based on overrepresentation of transcription factor binding profiles
- PMID: 16449500
- PMCID: PMC1415218
- DOI: 10.1101/gr.4303406
A systematic model to predict transcriptional regulatory mechanisms based on overrepresentation of transcription factor binding profiles
Abstract
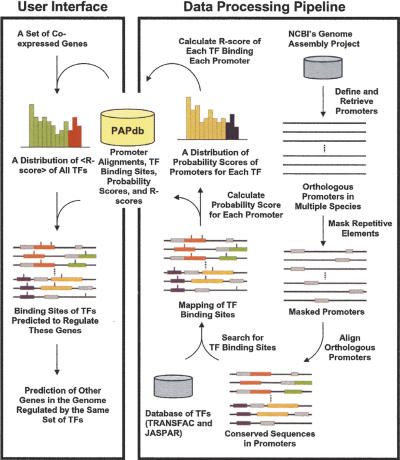
An important aspect of understanding a biological pathway is to delineate the transcriptional regulatory mechanisms of the genes involved. Two important tasks are often encountered when studying transcription regulation, i.e., (1) the identification of common transcriptional regulators of a set of coexpressed genes; (2) the identification of genes that are regulated by one or several transcription factors. In this study, a systematic and statistical approach was taken to accomplish these tasks by establishing an integrated model considering all of the promoters and characterized transcription factors (TFs) in the genome. A promoter analysis pipeline (PAP) was developed to implement this approach. PAP was tested using coregulated gene clusters collected from the literature. In most test cases, PAP identified the transcription regulators of the input genes accurately. When compared with chromatin immunoprecipitation experiment data, PAP's predictions are consistent with the experimental observations. When PAP was used to analyze one published expression-profiling data set and two novel coregulated gene sets, PAP was able to generate biologically meaningful hypotheses. Therefore, by taking a systematic approach of considering all promoters and characterized TFs in our model, we were able to make more reliable predictions about the regulation of gene expression in mammalian organisms.
Figures
Similar articles
-
PAP: a comprehensive workbench for mammalian transcriptional regulatory sequence analysis.Nucleic Acids Res. 2007 Jul;35(Web Server issue):W238-44. doi: 10.1093/nar/gkm308. Epub 2007 May 21. Nucleic Acids Res. 2007. PMID: 17517777 Free PMC article.
-
Predicting distinct organization of transcription factor binding sites on the promoter regions: a new genome-based approach to expand human embryonic stem cell regulatory network.Gene. 2013 Dec 1;531(2):212-9. doi: 10.1016/j.gene.2013.09.011. Epub 2013 Sep 13. Gene. 2013. PMID: 24042128
-
Genome-wide prediction of transcriptional regulatory elements of human promoters using gene expression and promoter analysis data.BMC Bioinformatics. 2006 Jul 4;7:330. doi: 10.1186/1471-2105-7-330. BMC Bioinformatics. 2006. PMID: 16817975 Free PMC article.
-
Bioinformatics approaches to predict target genes from transcription factor binding data.Methods. 2017 Dec 1;131:111-119. doi: 10.1016/j.ymeth.2017.09.001. Epub 2017 Sep 7. Methods. 2017. PMID: 28890129 Review.
-
Identifying novel transcriptional components controlling energy metabolism.Cell Metab. 2011 Dec 7;14(6):739-45. doi: 10.1016/j.cmet.2011.11.007. Cell Metab. 2011. PMID: 22152302 Free PMC article. Review.
Cited by
-
Systematic identification of genes associated with plant growth-defense tradeoffs under JA signaling in Arabidopsis.Planta. 2020 Jan 6;251(2):43. doi: 10.1007/s00425-019-03335-8. Planta. 2020. PMID: 31907627
-
A novel HMM-based method for detecting enriched transcription factor binding sites reveals RUNX3 as a potential target in pancreatic cancer biology.PLoS One. 2010 Dec 22;5(12):e14423. doi: 10.1371/journal.pone.0014423. PLoS One. 2010. PMID: 21203558 Free PMC article.
-
Genetic predisposition in NAFLD and NASH: impact on severity of liver disease and response to treatment.Curr Pharm Des. 2013;19(29):5219-38. doi: 10.2174/13816128113199990381. Curr Pharm Des. 2013. PMID: 23394097 Free PMC article.
-
Conserved Motifs and Prediction of Regulatory Modules in Caenorhabditis elegans.G3 (Bethesda). 2012 Apr;2(4):469-81. doi: 10.1534/g3.111.001081. Epub 2012 Apr 1. G3 (Bethesda). 2012. PMID: 22540038 Free PMC article.
-
An integrated approach to characterize transcription factor and microRNA regulatory networks involved in Schwann cell response to peripheral nerve injury.BMC Genomics. 2013 Feb 6;14:84. doi: 10.1186/1471-2164-14-84. BMC Genomics. 2013. PMID: 23387820 Free PMC article.
References
-
- Ao, W., Gaudet, J., Kent, W.J., Muttumu, S., and Mango, S.E. 2004. Environmentally induced foregut remodeling by PHA-4/FoxA and DAF-12/NHR. Science 305 1743–1746. - PubMed
-
- Baeuerle, P.A. and Baichwal, V.R. 1997. NF-κB as a frequent target for immunosuppressive and anti-inflammatory molecules. Adv. Immunol. 65 111–137. - PubMed
-
- Berg, O.G. and von Hippel, P.H. 1987. Selection of DNA binding sites by regulatory proteins. Statistical-mechanical theory and application to operators and promoters. J. Mol. Biol. 193 723–750. - PubMed
Publication types
MeSH terms
Substances
Grants and funding
LinkOut - more resources
Full Text Sources
Research Materials