Review
. 2006 Feb:209:212-36.
doi: 10.1111/j.0105-2896.2006.00355.x.

Progression of regulatory gene expression states in fetal and adult pro-T-cell development

Affiliations
Review

Progression of regulatory gene expression states in fetal and adult pro-T-cell development

Elizabeth-Sharon David-Fung et al. Immunol Rev. 2006 Feb.

Abstract

Precursors entering the T-cell developmental pathway traverse a progression of states characterized by distinctive patterns of gene expression. Of particular interest are regulatory genes, which ultimately control the dwell time of cells in each state and establish the mechanisms that propel them forward to subsequent states. Under particular genetic and developmental circumstances, the transitions between these states occur with different timing, and environmental feedbacks may shift the steady-state accumulations of cells in each state. The fetal transit through pro-T-cell stages is faster than in the adult and subject to somewhat different genetic requirements. To explore causes of such variation, this review presents previously unpublished data on differentiation gene activation in pro-T cells of pre-T-cell receptor-deficient mutant mice and a quantitative comparison of the profiles of transcription factor gene expression in pro-T-cell subsets of fetal and adult wildtype mice. Against a background of consistent gene expression, several regulatory genes show marked differences between fetal and adult expression profiles, including those encoding two basic helix-loop-helix antagonist Id factors, the Ets family factor SpiB and the Notch target gene Deltex1. The results also reveal global differences in regulatory alterations triggered by the first T-cell receptor-dependent selection events in fetal and adult thymopoiesis.


Figures

Figure 1
Figure 1
Crucial regulatory inputs into the T-cell commitment process. Genetic evidence shows that eight transcription factors or transcription factor families plus the Notch/Delta signaling system have essential roles in the generation of committed pro-T cells from hematopoietic stem cells (HSC). The figure summarizes data reviewed in (1).
Figure 2
Figure 2
Summary of T-cell development: stages, branchpoints, and checkpoints. Prethymic (yellow background) and intrathymic (white, green backgrounds) stages of T-cell development are diagrammed, in the context of the developmental options open to cells at each stage. White circles depict multipotent progenitors, black circles depict T-lineage committed stages, and the gray circle depicts the intermediate state of specified but uncommitted DN2 pro-T cells. “Commitment early” is the loss of B-cell potential, described in the text, and “commitment late” is the conclusion of T-lineage commitment with the loss of NK, DC, and macrophage (Mac) potentials. “Specification” denotes the gradual and asynchronous onset of T-lineage differentiation gene expression as described in the text. “Commitment late” concludes the TCR-independent phase of T cell development. Although cells from the DN3 stage onward can continue to give rise to different types of T cells, they can no longer give rise non-T cells unless genetically perturbed. “β-selection” is the strong proliferative and differentiative stimulus given only to those cells that successfully undergo productive TCRβ rearrangement; this marks the end of the pro-T cell stages. TCRγδ cells in general emerge when both γ and δ TCR chains are successfully rearranged before successful TCRβ rearrangement. Abbreviations: HSC/MPP: hematopoietic stem cell/multipotent progenitor; L/M Pre, putative lympho-myeloid restricted progenitor (26); Eryth/megak, erythroid or megakaryocytic. For all intrathymic stages, DN= CD4- CD8- (and surface TCR- here). DN1 = c-kit++ CD44+ CD25-; DN2 = c-kit++ CD44+ CD25+ HSA+; DN3 = c-kit- CD44- CD25+ HSA+; DN4 = c-kit- CD44-CD25- HSA+ intracellular TCRβ+. After DN stages, ISP = immature single positive, CD4- CD8+ intracellular TCRβ+; DP = double positive, TCRlow CD4+ CD8+ ; CD8 = mature TCRαβ+ CD4- CD8+; CD4 = mature TCRαβ+ CD4+ CD8-. DN1, DN2, and DN4 are the main stages of proliferation in the thymus. Most TCR gene rearrangement occurs in the DN3 and DP stages.
Figure 3
Figure 3
Developmental progression vs. population dynamics mechanisms: sources of potential flexibility in the subset distributions of developing T-lineage cells. Schematic depiction of the flexibility, in principle, that could enable the same number of DN1 cells to give rise to more or less DN2 and later derivatives in a steady state thymus without affecting the differentiation program as such. Evidence suggests that proliferation, selection criteria, and timing of cell death may be based on separable mechanisms from acquisition of T-cell characteristics (see text).
Figure 4
Figure 4
Expression patterns of T-lineage transcription factor and differentiation genes in pro-T cells: disparate rates of developmental change. (A) Q-PCR analysis of the expression of four critical T-lineage transcription factors and the differentiation gene CD3ε in the DN1-3 stages and through β-selection. Expression levels of these genes were determined in two independent series of sorted DN1-DN4 thymocytes, normalized to β-actin and averaged, and are shown on a log scale. Results for all genes were obtained from the same samples. See text for discussion. (B) and (C) Two models to explain why the increase in “differentiation gene” expression from before specification to commitment should be so much steeper than the increase in T-lineage transcription factor gene expression. (B) Expression of the differentiation gene may depend on combinatorial interactions between transcription factors, so that individual cis-regulatory site occupancies must be multiplied to generate the output expression level. (C) Expression of the differentiation gene may depend not on the known factors, but on an unknown transcription factor that undergoes a steeper increase in its own expression from DN1 to DN3 stage. In this version of the model the unknown transcription factor (X) is itself proposed to be activated by an unspecified combination of other T-lineage regulators. A third possible type of model, not shown, could include steeply downregulated factors like PU.1 as possible rate-limiting antagonists of differentiation gene expression. Unfortunately, the regulatory sequences for CD3ε itself are still uncharacterized and cannot help to distinguish yet between these types of models.
Figure 5
Figure 5
Asynchronous and noncoordinate onset of T-lineage gene expression during T-lineage specification: alternative programs of gene activation? This figure compares gene expression in definitively specified pro-T cells (DN2, DN3) with gene expression in diverse populations of pre-specification thymocytes [all CD44+ CD25-, mostly also HSA (CD24) low] that differ in T-lineage potential. (A) The most primitive c-kit+ DN1 cells are found in the Sca-1+ Thy-1lo HSAlo population (green arrows). Data are shown from a five-color flow cytometric analysis of wildtype DN thymocytes (B6 depl = B6 depleted of CD8+, TCR+, and non-lymphoid cells). A parallel analysis is shown of TCRβ-/- δ-/- mutant thymocytes which cannot progress beyond the DN3 stage, confirming that all the subsets shown are generated through TCR-independent processes. HSA is strongly expressed by all CD25+ DN cells (DN2 and DN3), by DN4 cells, and by any B-lineage precursors (39). The HSA-low/negative subsets can be subdivided by Thy-1, Sca-1, NK1.1, c-kit, and other markers to provide sensitive discrimination of DN1 cells (“DN1a”, (18)) and other immature minority populations (39;115;120;124;192). Top panels: c-kit+ DN1 cells are found in the Sca-1+ population of HSAlo cells, not the Sca-1- HSAlo cells. Middle panels: HSAlo c-kit+ cells (“DN1a”, (18)) are predominantly Sca-1+ Thy-1lo, but as they acquire HSA (“DN1b”, (18)) they also become Thy-1hi. (B) Definition of thymocyte subsets for gene expression analysis. In both wildtype thymocytes and mutants blocked in pre-TCR assembly, Sca-1hi and Sca-1lo subsets of HSAlo thymocytes are further subdivided by Thy-1 and CD4 staining. TCRβ-/- δ-/- results shown in upper panel are representative of Rag-2-/- and SCID subpopulations as well (M. A. Y., unpublished data). In all these mutants, populations 1 and 2, Sca-1lo Thy-1+ and Thy-1- cells, are shown elsewhere to express NK1.1 and CD122 almost uniformly and represent NK lineage cells (115;120;124). Sca-1+ HSAlo cells were separated into CD4- Thy-1lo (population 3) and CD4- Thy-1+ (population 5) subsets. CD4+ cells were sorted separately (population 4) (118); but in mutant thymocytes that cannot undergo β-selection, this population does not contain any T-cell precursors (122). Numbering of subsets in this panel corresponds to numbers in panel C and lane numbers in panels D & E. (C) TCR-independent differentiation potential in TCRβ-/-δ-/- HSA-low DN cells is confined to cells in HSA-low DN population 3. Mutant thymocytes unable to go through β-selection were used to eliminate the possibility of more mature cell contaminants in any HSA-low DN fractions. Thy-1, CD44, and HSA staining profiles are shown for populations 1+2, population 3, and population 5, isolated as in panel B, both initially and after reaggregation into thymic epithelial lobes and culture for 8-14 days in fetal thymus organ culture. Note that only descendents of population 3 generated HSA+ Thy-1+ CD44- DN3 cells. Descendents of populations 1+2 remained unchanged and also retained predominant NK1.1+ phenotype after fetal thymic organ culture (M. A. Y., unpublished data). Descendents of population 5 failed to proliferate or generate DN3 cells in spite of their high Thy-1+ phenotype and expression of certain other T-lineage genes (panels E & E). (D) and (E) Expression of T-lineage and non-T-lineage genes in subsets of pro-T cells and other HSA-low DN thymocytes. Thymocytes from two different mutant mouse strains that are arrested at the β-selection checkpoint were used as starting material to exclude any possible contamination with mature TCR+ cells. Populations 1-5 were sorted as indicated (cf. panel B) and compared with DN2 (CD25+ CD44+ HSA+, pop. 6) and DN3 (CD25+ CD44- HSA+, pop. 7) cells from the same thymus. Semiquantititative RT-PCR analyses were performed as previously described (115;119;124;192) using primers for T-lineage genes and “lineage inappropriate” genes (indicated by asterisks: genes expressed preferentially in B-lineage, monocytic, and dendritic cells). The results shown are representative of over six independent experiments with Rag-2-/-, TCRβ-/- δ-/-, and SCID thymocytes (H. W., R. A. D., and E. V. R., unpublished data). Note that all the T-lineage genes and none of the “inappropriate” genes are expressed in both DN2 and DN3 stages, whereas the gene expression patterns in populations 3, 4, and 5 reveal substantial diversity and suggest some early cross-lineage gene activation.
Figure 6
Figure 6
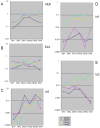
Comparison of bHLH transcription factor and antagonist gene expression in fetal and adult DN thymocytes, pro-T stages through β-selection: fetal-specific increase in Id1 and Id2. Q-PCR analyses of expression of the bHLH factors HEB (A) and E2A (B) and the antagonists Id1 (D), Id2 (E), and Id3 (C) are shown for two independent series each of E14.5 fetal and adult DN thymocyte subsets. Primers used for the realtime PCR analysis are listed in Table 1. Adult (navy and magenta) and fetal (yellow and cyan) data are presented as individual series without averaging, to distinguish systematic variation between fetal and adult series from variation between independent samples of the same type. The adult samples shown here and in Figs. 7-9 are different sets from those used to generate Fig. 4. However, all the samples used in Figs. 6-9 are the same and the results shown are directly comparable. Adult and fetal thymocytes were both prepared by first depleting CD8+, CD3+, TCRγδ+, and Ter-119+ cells, and then performing two sorts on the FACSAria. DN1, DN2, DN3a, and DN3b cells were sorted based on c-kit, CD27, CD44, and CD25 expression from one aliquot, while total DN3 (DN3-t) and DN4 cells were sorted based on c-kit, CD44, CD25, and HSA expression from another aliquot or another cell preparation. In the graphs, DN3-t samples are ordered between the DN2 and DN3a samples to reproduce the DN1-DN2-DN3 (total) succession shown in Fig. 4, to permit the most direct comparison between DN3a and DN3b, and to juxtapose DN3b samples with the DN4 samples that represent their immediate descendents. Note that for genes that are strongly upregulated at β-selection like Id3 (C), the inclusion of DN3b-type cells in the DN3-t sample can make the trend lines appear jagged. As we report elsewhere in detail (T. Taghon et al., submitted), the effects of β-selection in adult thymocytes are seen most clearly in the comparison between DN3a (preselection) and DN3b (newly selected) cells. In these panels, note that the variability between series in panels (A) and (B) (especially adult samples after β-selection, magenta and navy) fully encompasses the differences between adult and fetal samples. For calibration of these differences, compare the similar patterns and levels of expression of HEB (A) with those from independent samples in Fig. 4A. In contrast, the fetal expression patterns (yellow and cyan) lie distinctly outside the adult patterns (magenta and navy) in panels (D) and (E).
Figure 7
Figure 7
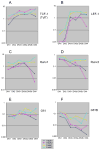
Comparison between adult and fetal pro-T cell expression of TCF/LEF, Runx, and Gfi1 family transcription factors: differences in magnitude and regulation post β-selection. (A) TCF-1 (Tcf7) expression. (B) LEF-1 expression. (C) Runx1 expression. (D) Runx3 expression. (E) Gfi1 expression. (F) Gfi1B expression. See legend to Fig. 6 for explanation of samples. Primers used in Q-PCR analyses are listed in Table 1. Compare the similar levels and patterns of TCF-1 expression (A) with those in independent samples in Fig. 4A.
Figure 8
Figure 8
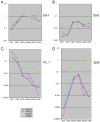
Comparison between adult and fetal pro-T cell expression of Ets family transcription factors: fetal-specific upregulation of SpiB. (A) Ets1 expression. (B) Ets2 expression. (C) PU.1 expression. (D) SpiB expression. See legend to Fig. 6 for explanation of samples. Compare the similar levels and patterns of PU.1 expression in the adult samples in (C) with those shown in independent samples in Fig. 4A.
Figure 9
Figure 9
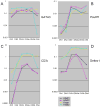
Comparison between adult and fetal pro-T cell expression of distinctly regulated components of the T-cell specification gene set. (A) GATA-3 expression. (B) Pou6f1 expression. (C) CD3ε expression. (D) Deltex1 expression. See legend to Fig. 6 for explanation of samples. For adult samples, compare the similarity between the GATA-3 and CD3ε levels and patterns of expression in (A) and (C) with those shown in independent samples in Fig. 4A. Although both are tightly associated with the T-cell specification mechanism, both CD3ε and Deltex1 are expressed at remarkably different levels in fetal and adult thymocytes from the earliest DN1 stage throughout the pro-T cell stages.

Similar articles

Cited by

References

    1. Rothenberg EV, Taghon T. Molecular Genetics of T Cell Development. Annu Rev Immunol. 2005;23:601–49. - PubMed
    1. Rothenberg EV, Anderson MK. Elements of transcription factor network design for T-lineage specification. Devel Biol. 2002;246:29–44. - PubMed
    1. Han H, Tanigaki K, Yamamoto N, Kuroda K, Yoshimoto M, Nakahata T, Ikuta K, Honjo T. Inducible gene knockout of transcription factor recombination signal binding protein-J reveals its essential role in T versus B lineage decision. Int Immunol. 2002;14:637–45. - PubMed
    1. Tanigaki K, Tsuji M, Yamamoto N, Han H, Tsukada J, Inoue H, Kubo M, Honjo T. Regulation of αβ/γδ T cell lineage commitment and peripheral T cell responses by Notch/RBP-J signaling. Immunity. 2004;20:611–22. - PubMed
    1. Maillard I, Weng AP, Carpenter AC, Rodriguez CG, Sai H, Xu L, Allman D, Aster JC, Pear WS. Mastermind critically regulates Notch-mediated lymphoid cell fate decisions. Blood. 2004;104:1696–702. - PubMed

Publication types

MeSH terms

Substances