. 2006 Feb;80(4):1662-71.
doi: 10.1128/JVI.80.4.1662-1671.2006.

Poliovirus protein 3AB displays nucleic acid chaperone and helix-destabilizing activities

Affiliations

Poliovirus protein 3AB displays nucleic acid chaperone and helix-destabilizing activities

Jeffrey J DeStefano et al. J Virol. 2006 Feb.

Abstract

Poliovirus protein 3AB displayed nucleic acid chaperone activity in promoting the hybridization of complementary nucleic acids and destabilizing secondary structure. Hybridization reactions at 30 degrees C between 20- and 40-nucleotide RNA oligonucleotides and 179- or 765-nucleotide RNAs that contained a complementary region were greatly enhanced in the presence of 3AB. The effect was nonspecific as reactions between DNA oligonucleotides and RNA or DNA templates were also enhanced. Reactions were optimal with 1 mM MgCl(2) and 20 mM KCl. Analysis of the reactions with various 3AB and template concentrations indicated that enhancement required a critical amount of 3AB that increased as the concentration of nucleic acid increased. This was consistent with a requirement for 3AB to "coat" the nucleic acids for enhancement. The helix-destabilizing activity of 3AB was tested in an assay with two 42-nucleotide completely complementary DNAs. Each complement formed a strong stem-loop (DeltaG = -7.2 kcal/mol) that required unwinding for hybridization to occur. DNAs were modified at the 3' or 5' end with fluorescent probes such that hybridization resulted in quenching of the fluorescent signal. Under optimal conditions at 30 degrees C, 3AB stimulated hybridization in a concentration-dependent manner, as did human immunodeficiency virus nucleocapsid protein, an established chaperone. The results are discussed with respect to the role of 3AB in viral replication and recombination.


Figures

FIG. 1.
FIG. 1.
Nucleic acids used in hybridization assays. (A) Shown are schematic diagrams of the RNA and DNA complements used in the assays. Preparation of the 765- and 179-nucleotide RNAs and the 201-nucleotide DNA is described under Materials and Methods. The regions where the complementary primers bind to the longer strand are indicated along with the nucleotide numbers (5′→3′) where binding occurs. Only the first 23 nucleotides from the 5′ end of D40 bind to the 3′ end of 201 DNA. All three long nucleic acids are related. The numbers in parentheses below 201 DNA correspond to the numbers in 179 and 765 RNA, with the first base in 201 DNA corresponding to base 40. The 179-nucleotide RNA is identical to the first 179 bases of 765 RNA. (B) Nucleotide sequences of the various oligonucleotides. Note that D40 is a DNA version of R40.
FIG. 2.
FIG. 2.
Primer extension assay with 3AB and 3Dpol. Shown is an autoradiogram from a 3Dpol primer extension assay performed with 5′ 32P-end-labeled R40 primer and the 765-nucleotide RNA template (see Fig. 1). Primer (15 nM) and template (10 nM) were mixed in the presence or absence of 650 nM 3AB (as indicated) with various amounts of 3Dpol (10, 20, 41, 81, 163, 325, or 650 nM), incubated for 1 h at 30°C, and then resolved on a 6% denaturing polyacrylamide gel. In lanes 1 and 2, the primer was prehybridized to the template by heating and slow cooling and extended in the absence or presence (lanes 1 and 2, respectively) of 3AB with 163 nM 3Dpol. Lane C, no 3Dpol added. The positions of the primer and 256-nucleotide fully extended product are indicated.
FIG. 3.
FIG. 3.
Hybridization assays with various RNAs and DNAs in the presence and absence of 3AB. Shown is an autoradiogram of an experiment in which various 5′ 32P-labeled RNA oligonucleotides (10 nM) were incubated with complementary long RNAs or DNAs (10 nM) (see Fig. 1) in the presence or absence of 650 nM 3AB. The samples were run on a 6% native polyacrylamide gel. The positions of hybrids and free oligonucleotides are indicated. Lanes A contained oligonucleotide and complement that were not hybridized. In lanes B, the oligonucleotide was prehybridized to the complement by heating and slow cooling. Lanes C and D show samples incubated for 30 min in the absence (C) or presence (D) of 3AB. The positions of free and hybridized oligonucleotides and the gel wells are indicated.
FIG. 4.
FIG. 4.
Hybridization assay with non-3AB-containing E. coli fractions corresponding to 3AB-containing fractions. Shown is an autoradiogram of an assay using 5′ 32P-end-labeled R20-1 (10 nM) and the 179-nucleotide RNA (10 nM) (see Fig. 1). Either 3AB (650 nM) or corresponding fractions from E. coli that were transformed with the pGEX vector not containing the 3AB gene sequence insert were added to the samples and incubated for 15 min at 30°C. Lane 1, no addition; lane 2, 3AB; lane 3, 3AB and 1× equivalent from non-3AB-containing fraction; lanes 4, 5, and 6, 1×, 2×, and 4× equivalents, respectively, from non-3AB fractions. Lanes A and B, R20-1 without the 179 RNA in the absence (A) or presence (B) of 3AB. Lane C, R20-1 and 179 RNA prehybridized by heating and slow cooling. Other details are as indicated in Fig. 2.
FIG. 5.
FIG. 5.
Determination of optimal conditions for 3AB hybridization stimulation. Shown is a plot of the amount of hybridized oligonucleotide versus the concentration of MgCl2 (triangles) or KCl (circles) for an experiment using 5′ 32P-labeled R20-1 and the 179-nucleotide cRNA (see Fig. 1) at a concentration of 10 nM each, in the presence (open symbols) or absence (solid symbols) of 1,200 nM 3AB. Assays were performed for 8 min, at which time stop solution was added and samples were run on a 6% native polyacrylamide gel. Dried gels were quantified with a phosphoimager. The KCl titration was performed using 1 mM MgCl2, while the MgCl2 titration was performed with 20 mM KCl. The experiments shown in Fig. 5 were repeated with similar results.
FIG. 6.
FIG. 6.
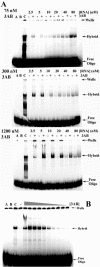
(A and B) Stimulation of hybridization with different amounts of 3AB and template RNA. (A) The experiments were performed using optimal conditions as shown in Fig. 5, except that the amount of 179-nucleotide RNA in the assays was varied between 2.5 and 80 nM (as indicated) and 5′ 32P-labeled R20-1 was held constant at 10 nM. Protein 3AB concentrations of 75, 300, or 1,200 nM (as indicated on panel) were used. The positions of free and hybridized R20-1 oligonucleotide and the gel wells are indicated. Lanes A, B, and C are as described in the legend to Fig. 4. (B) In this experiment, 5′ 32P-end-labeled R20-1 and 179-nucleotide RNA template were held constant at 10 and 5 nM, respectively, while the concentration of 3AB was varied. Samples were incubated for 8 min at 30°C with increasing amounts of 3AB (2.5, 4.5, 9.5 19, 38, 75, 150, 300, 600, or 1,200 nM) and processed as described in the legend to Fig. 3. Lanes A, B, and C are as described in the legend to Fig. 4, while other labels are described in the legend to Fig. 3. This experiment was repeated with similar results.
FIG. 7.
FIG. 7.
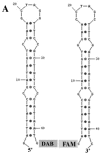
(A to F) Gel-based and FRET-based helix-destabilization assay with 3AB. (A) Structural depiction of the complementary 42-nucleotide DNA substrates as predicted by mfold (see Materials and Methods). Folded structures had ΔG values of approximately −7.2 kcal/mol. One complement had a FAM group (fluorophor) at the 5′ end, while the other had a DABCYL group (quencher) at the 3′ end (see Materials and Methods). (B) Gel shift assay. Shown is an autoradiogram of an assay performed by mixing complementary 42-nucleotide nucleic acid pairs as described under Materials and Methods in the presence or absence of 3AB (amount indicated) for the times indicated. Samples were run on a 12% native polyacrylamide gel to separate hybrids from single-stranded DNA (as indicated). In this experiment, the DABCYL complement (10 nM in reactions) shown in panel A was 5′-end labeled with 32P while the FAM complement (5 nM) was not. Other labels are as indicated in Fig. 3. (C) Plot of femtomoles of hybridized DNA versus time. The asterisk indicates that the total amount of DABCYL DNA in each time point aliquot was 150 fmol, and the amount hybridized was calculated by dividing the hybrid amount by the sum of hybrid and free oligonucleotide in the lane and multiplying by 150. The theoretical maximum amount of hybrid would be 75 fmol, the amount of complementary FAM DNA in the reactions. (D to F) Shown are plots of Ir versus time for experiments conducted with the DNA complements shown in panel A using the FRET-based assay. Complements were mixed in the presence or absence of various amounts of 3AB (D), 3Dpol (E), or HIV nucleocapsid protein (NC) (F), and samples were monitored using a florescence spectrophotometer. Upon hybridization, the FAM and DABCYL groups are brought into close proximity. Florescence from the FAM group is quenched by the DABCYL group of the complement, resulting in a decrease in the reading. The Ir is the level of florescence at a given time point (It) divided by the level at time zero (I0). Control experiments conducted with the FAM-labeled strand alone in the presence of the highest concentration of the various proteins (open circles) or with the FAM and DABCYL complements but without added protein (filled circles) showed little or no quenching. Note the smaller amount of protein and different time scale used in the experiment with NC (F). These experiments were repeated with similar results.
FIG. 7.
FIG. 7.
(A to F) Gel-based and FRET-based helix-destabilization assay with 3AB. (A) Structural depiction of the complementary 42-nucleotide DNA substrates as predicted by mfold (see Materials and Methods). Folded structures had ΔG values of approximately −7.2 kcal/mol. One complement had a FAM group (fluorophor) at the 5′ end, while the other had a DABCYL group (quencher) at the 3′ end (see Materials and Methods). (B) Gel shift assay. Shown is an autoradiogram of an assay performed by mixing complementary 42-nucleotide nucleic acid pairs as described under Materials and Methods in the presence or absence of 3AB (amount indicated) for the times indicated. Samples were run on a 12% native polyacrylamide gel to separate hybrids from single-stranded DNA (as indicated). In this experiment, the DABCYL complement (10 nM in reactions) shown in panel A was 5′-end labeled with 32P while the FAM complement (5 nM) was not. Other labels are as indicated in Fig. 3. (C) Plot of femtomoles of hybridized DNA versus time. The asterisk indicates that the total amount of DABCYL DNA in each time point aliquot was 150 fmol, and the amount hybridized was calculated by dividing the hybrid amount by the sum of hybrid and free oligonucleotide in the lane and multiplying by 150. The theoretical maximum amount of hybrid would be 75 fmol, the amount of complementary FAM DNA in the reactions. (D to F) Shown are plots of Ir versus time for experiments conducted with the DNA complements shown in panel A using the FRET-based assay. Complements were mixed in the presence or absence of various amounts of 3AB (D), 3Dpol (E), or HIV nucleocapsid protein (NC) (F), and samples were monitored using a florescence spectrophotometer. Upon hybridization, the FAM and DABCYL groups are brought into close proximity. Florescence from the FAM group is quenched by the DABCYL group of the complement, resulting in a decrease in the reading. The Ir is the level of florescence at a given time point (It) divided by the level at time zero (I0). Control experiments conducted with the FAM-labeled strand alone in the presence of the highest concentration of the various proteins (open circles) or with the FAM and DABCYL complements but without added protein (filled circles) showed little or no quenching. Note the smaller amount of protein and different time scale used in the experiment with NC (F). These experiments were repeated with similar results.

Similar articles

Cited by

References

    1. Andino, R., G. E. Rieckhof, P. L. Achacoso, and D. Baltimore. 1993. Poliovirus RNA synthesis utilizes an RNP complex formed around the 5′-end of viral RNA. EMBO J. 12:3587-3598. - PMC - PubMed
    1. Arnold, J. J., S. K. Ghosh, and C. E. Cameron. 1999. Poliovirus RNA-dependent RNA polymerase (3Dpol). J. Biol. Chem. 274:37060-37069. - PubMed
    1. Banerjee, R., and A. Dasgupta. 2001. Interaction of picornavirus 2C polypeptide with the viral negative-strand RNA. J. Gen. Virol. 82:2621-2627. - PubMed
    1. Banerjee, R., A. Echeverri, and A. Dasgupta. 1997. Poliovirus-encoded 2C polypeptide specifically binds to the 3′-terminal sequences of viral negative-strand RNA. J. Virol. 71:9570-9578. - PMC - PubMed
    1. Baron, M. H., and D. Baltimore. 1982. Anti-VPg antibody inhibition of the poliovirus replicase reaction and production of covalent complexes of VPg-related proteins and RNA. Cell 30:745-752. - PubMed

LinkOut - more resources