. 2006 Apr 15;572(Pt 2):359-77.
doi: 10.1113/jphysiol.2005.103143. Epub 2006 Jan 26.

Human TRPC6 expressed in HEK 293 cells forms non-selective cation channels with limited Ca2+ permeability

Affiliations

Human TRPC6 expressed in HEK 293 cells forms non-selective cation channels with limited Ca2+ permeability

Mark Estacion et al. J Physiol. .

Abstract

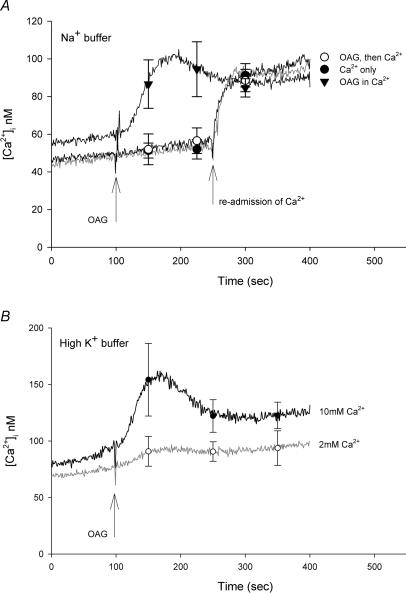
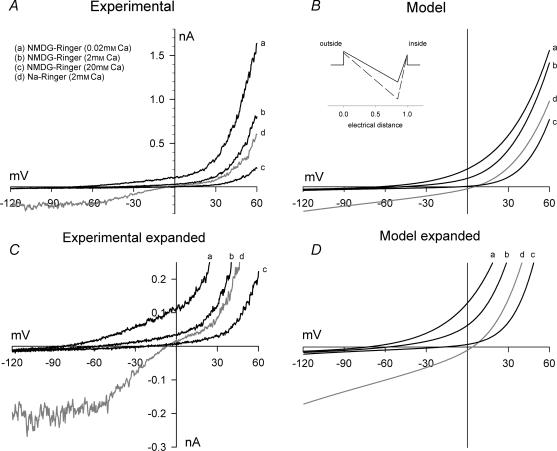
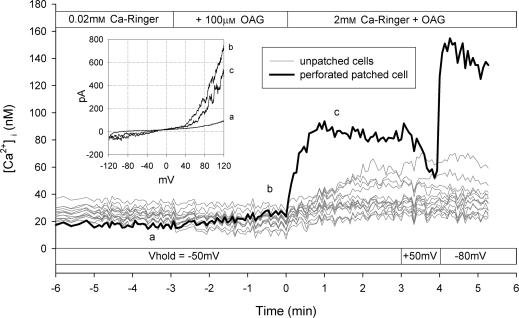
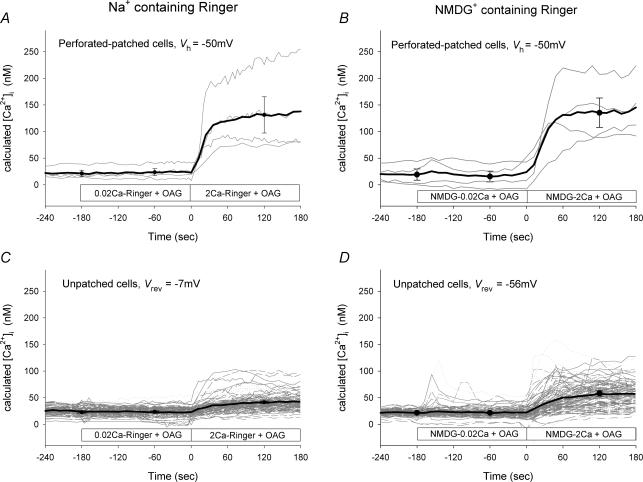
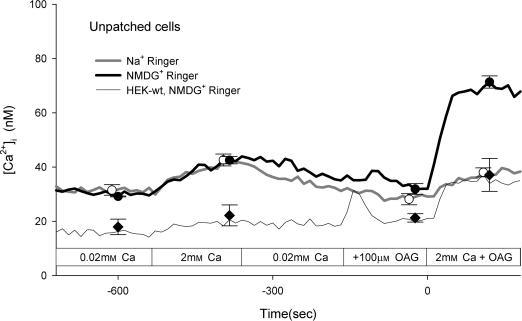
TRPC6 is thought to be a Ca(2+)-permeable cation channel activated following stimulation of G-protein-coupled membrane receptors linked to phospholipase C (PLC). TRPC6 current is also activated by exogenous application of 1-oleoyl-acetyl-sn-glycerol (OAG) or by inhibiting 1,2-diacylglycerol (DAG) lipase activity using RHC80267. In the present study, both OAG and RHC80267 increased whole-cell TRPC6 current in cells from a human embryonic kidney cell line (HEK 293) stably expressing TRPC6, but neither compound increased cytosolic free Ca(2+) concentration ([Ca(2+)](i)) when the cells were bathed in high-K(+) buffer to hold the membrane potential near 0 mV. These results suggested that TRPC6 channels have limited Ca(2+) permeability relative to monovalent cation permeability and/or that Ca(2+) influx via TRPC6 is greatly attenuated by depolarization. To evaluate Ca(2+) permeability, TRPC6 currents were examined in extracellular buffer in which Ca(2+) was varied from 0.02 to 20 mm. The results were consistent with a pore-permeation model in which Ca(2+) acts primarily as a blocking ion and contributes only a small percentage ( approximately 4%) to whole-cell currents in the presence of extracellular Na(+). Measurement of single-cell fura-2 fluorescence during perforated-patch recording of TRPC6 currents showed that OAG increased [Ca(2+)](i) 50-100 nm when the membrane potential was clamped at between -50 and -80 mV, but had little or no effect if the membrane potential was left uncontrolled. These results suggest that in cells exhibiting a high input resistance, the primary effect of activating TRPC6 will be membrane depolarization. However, in cells able to maintain a hyperpolarized potential (e.g. cells with a large inwardly rectifying or Ca(2+)-activated K(+) current), activation of TRPC6 will lead to a sustained increase in [Ca(2+)](i). Thus, the contribution of TRPC6 current to both the kinetics and magnitude of the Ca(2+) response will be cell specific and dependent upon the complement of other channel types.


Figures

Figure 1
Figure 1. Stimulation of TRPC6 channels expressed in HEK 293 cells
A, whole-cell membrane currents were recorded in TRPC6-expressing HEK 293 cells (circles) or lacZ-transfected control cells (inverted triangles) as described in the Methods. Voltage ramps were applied every 15 s and the outward current at +80 mV (filled symbols) and inward current at −80 mV (open symbols) during each ramp is plotted as a function of time after rupture of the patch for whole-cell recording. At the time indicated by the horizontal bar, the bath solution was changed to one containing carbachol (CCh; 100 μ m). B, current–voltage (I–V) relationships obtained in the presence of CCh at the times indicated (a, b and c) in A. C and D, same as in A and B with OAG added at the time indicated by the horizontal bar. I–V relationship was obtained at the time indicated (d) in C. E, fura-2-loaded HEK 293 cells stably expressing TRPC6 were suspended in Ca2+-free–high-K+ HBS and the fluorescence ratio was recorded as a function of time as described in the Methods. Three traces are shown superimposed. CCh (100 μ m; ○) or OAG (100 μ m; •) was added to the cuvette at the time indicated by the arrow. Ca2+ (10 mm) was added in all cases at 300 s. The third trace shows the addition of Ca2+ alone at 300 s (▾). Curves represent mean values of three independent experiments; symbols represent mean ± s.e.m. values at selected time points.
Figure 2
Figure 2. Stimulation of TRPC6 by the DAG lipase inhibitor, RHC80267
A, whole-cell membrane currents were recorded in TRPC6-expressing HEK 293 cells as described in the legend to Fig. 1. At the time indicated by the horizontal bar, the bath solution was changed to one containing RHC80267 (RHC; 50 μ m). Inset shows the I–V relationship at 5 min. B, mean ± s.e.m outward (upward bars) and inward (downward bars) current activation rates following the addition of RHC as shown in A at the indicated concentrations. The numbers in parentheses indicate the number of individual cells tested. C, fura-2-loaded HEK 293 cells stably expressing TRPC6 channels were suspended in Ca2+-free–high-K+ HBS. Four traces are shown superimposed; RHC or CCh were added as indicated to the right of each trace. RHC (50 μ m) was added to the cuvette at 50 s, CCh (100 μ m) was added at 100 s, and Ca2+ (10 mm) was added in each case at 300 s. D, same as in C except 1 μ m CCh was added at the time indicated. Curves represent mean values of three independent experiments; symbols represent mean ± s.e.m. values at selected time points.
Figure 3
Figure 3. Blockade of TRPC6 by U73122 and U73343
A, whole-cell membrane currents were recorded in TRPC6-expressing HEK 293 cells as described in the legend to Fig. 1. At the time indicated by the horizontal bar, the bath solution was changed to one containing CCh (100 μ m). Next, 2 min after addition of CCh, the solution was changed to one containing CCh plus U73343 (10 μ m). B, mean ± s.e.m. outward (upward bars) and inward (downward bars) current remaining 3 min after the addition of either DMSO (control), U73343 or U73122 as shown in A. Numbers in parentheses indicated the number of cells tested under each condition. C and D, same as A and B, but with DMSO (circles) or U73343 (squares) added before CCh. E, fura-2-loaded HEK 293 cells stably expressing TRPC6 were suspended in Ca2+-free–high-K+ HBS. Four traces are shown superimposed; U73122, U73343 and CCh were added as indicated to the right of each trace. U73343 or U73122 (10 μ m) were added to the cuvette at 100 s, CCh (100 μ m) was added at 300 s, and Ca2+ (10 mm) was added in all cases at 500 s. Curves represent mean values of three independent experiments; symbols represent mean ± s.e.m. values at selected time points.
Figure 4
Figure 4. Effect of OAG in the presence of extracellular Ca2+
A, fura-2-loaded HEK 293 cells stably expressing TRPC6 channels were suspended in either normal Na+-containing HBS (▾) or Ca2+-free–high-K+ HBS (○ and •). OAG (100 μ m) was added to the cuvette at the time indicated by the arrow in the absence (○) or presence (▾) of 2 mm Ca2+. One trace shows the addition of Ca2+ alone at 250 s (•). B, fura-2-loaded HEK 293 cells stably expressing TRPC6 channels were suspended in high-K+ HBS containing either 2 or 10 mm Ca2+ as indicated. Curves represent mean values of three independent experiments; symbols represent mean ± s.e.m. values at selected time points.
Figure 5
Figure 5. Effect of extracellular Ca2+ on whole-cell currents in TRPC6-expressing HEK 293 cells: NMDG buffer
A, currents were recorded as described in the legend to Fig. 1 in HEK 293 cells stably expressing TRPC6. TRPC6 current was activated by superfusion with normal Na+-containing Ringer solution with 100 μ m OAG. A representative I–V plot under this condition is shown (d). The extracellular solution was changed to NMDG–0K+ Ringer solution with 0.02 (a), 2 (b) or 20 mm Ca2+ (c). B, I–V relationships predicted by a single-site pore permeation model with the following parameters (see inset): outer and inner barriers were placed at the outer and inner limit of the electric field; the energy well was placed 85% across the electric field; the outer and inner barrier energies for monovalent cations were 4.0 and 3.0 RT units, respectively, and for Ca2+ the levels were 3.5 and 3.0 RT units, respectively; and the energy level for the well was −5 and −10 RT units for monovalent cations and Ca2+, respectively. The simulated I–V plots are shown for the experimental ionic conditions shown in A. C and D, same as A and B with an expanded current scale to better visualize the reversal potentials under each condition.
Figure 6
Figure 6. Effect of extracellular Ca2+ on reversal potential
The reversal potentials for TRPC6 currents recorded in NMDG-containing solution with either 0 (•) or 4 mm K+ (formula image
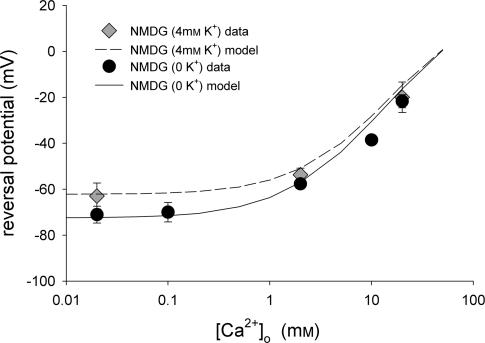
) as in Fig. 5 are plotted as a function of extracellular Ca2+ concentration (n = 3–17 for each data point). The lines drawn are the values predicted from the single-site pore model under each ionic condition.
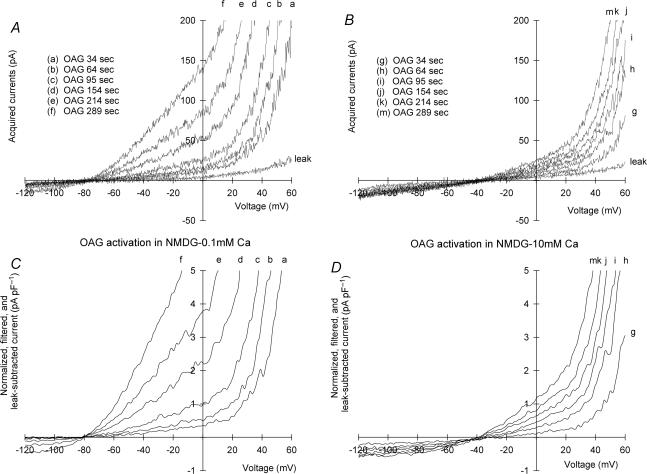
Figure 7
Figure 7. Activation of TRPC6 current in low-or high-Ca2+ buffer
A and B, currents were recorded as described in the legend to Fig. 1 in HEK 293 cells stably expressing TRPC6. TRPC6 current was activated by superfusion with NMDG–0K+ Ringer solution containing 0.1 (A) or 10 mm Ca2+ (B) plus 100 μ m OAG. I–V curves are shown before OAG (leak) and as a function of time after addition of OAG (see inset to A and B). C and D, currents from A and B were leak-subtracted, normalized to capacitance, and filtered at 200 Hz.
Figure 8
Figure 8. Effect of extracellular Ca2+ on whole-cell currents in TRPC6-expressing HEK 293 cells: normal Na+ buffer
A, currents were recorded as described in the legend to Fig. 1 in HEK 293 cells stably expressing TRPC6. TRPC6 current was activated by superfusion with normal Na+-containing Ringer solution containing 100 μ m OAG. A representative I–V curve under this condition is shown (d). The extracellular solution was changed to Na+-containing Ringer solution with various Ca2+ concentrations (inset). B, I–V relationships predicted by the single-site pore permeation model with the parameter set given in the legend to Fig. 5. The simulated I–V curves are shown for the experimental ionic conditions shown in A. C and D, same as A and B with an expanded current scale to better visualize the reversal potentials under each condition. E and F, to determine the voltage-dependence of the block by Ca2+, current traces in 0.2–20 mm Ca2+ were normalized to the values observed in the presence of 0.1 mm Ca2+. Fractional current is shown as a function of membrane potential for both the experimental and model-derived data sets as indicated.
Figure 9
Figure 9. Simultaneous recording of membrane current and fura-2 fluorescence using the perforated-patch technique and optical imaging
HEK 293 cells stably expressing TRPC6 were loaded with fura-2 using the AM form. Whole-cell membrane currents were recorded in one cell using the perforated-patch technique and [Ca2+]i was determined as a function of time in all cells within the field of view as described in the Methods. The inset shows the I–V relationship at the indicated time points (a–c). Upper horizontal bar indicates solution changes, whereas the lower bar indicates holding potential of the cell subjected to voltage clamp. [Ca2+]i is shown for the patched cell (black trace) and for each individual unpatched cell (grey traces). Result shown is from a single coverslip.
Figure 10
Figure 10. Effect of membrane potential on [Ca2+]i in TRPC6-expressing HEK 293 cells
[Ca2+]i was determined as described in the legend to Fig. 9 in both patched cells (A and B) and unpatched cells (C and D) in the field of view. Patched cells (n = 4) were held at −50 mV throughout the experiment. Horizontal bar indicates the solution changes. Panels on the left were recorded in normal Na+-containing Ringer solution, whereas those on the right were obtained in NMDG-containing Ringer solution. Black lines in A and B represent mean values of four cells; symbols represent mean ± s.e.m. values at selected time points. Black lines in C and D represent mean values of 9–10 independent experiments (i.e. coverslips); symbols represent mean ± s.e.m. values at selected time points. Individual cells are shown in grey (C, n = 103 cells; D, n = 112 cells). Vrev indicates the value of the TRPC6 current reversal potentials from Fig. 5 recorded in either Na+ or NMDG+. Vh is the holding potential.
Figure 11
Figure 11. OAG has no effect on [Ca2+]i in normal Na+-containing Ringer solution
[Ca2+]i was determined as described in the legend to Fig. 9 on HEK 293 cells stably expressing TRPC6 channels perfused with Na+-(•) or NMDG-containing Ringer solution (○, see inset). The horizontal bar indicates the solution changes. For comparison, the same experiment was performed on wild-type HEK 293 cells perfused with NMDG-containing Ringer solution (♦). Curves represent mean values of three independent experiments; symbols represent mean ± s.e.m. values at selected time points. For clarity, individual cells under each condition (51, 42 and 75 cells) are not shown.

Similar articles

Cited by

References

    1. Arnon A, Hamlyn JM, Blaustein MP. Ouabain augments Ca2+ transients in arterial smooth muscle without raising cytosolic Na+ Am J Physiol Heart Circ Physiol. 2000;279:H679–H691. - PubMed
    1. Artigas P, Gadsby DC. Large diameter of palytoxin-induced Na/K pump channels and modulation of palytoxin interaction by Na/K pump ligands. J Gen Physiol. 2004;123:357–376. - PMC - PubMed
    1. Bandyopadhyay BC, Swaim WD, Liu X, Redman R, Patterson RL, Ambudkar IS. Apical localization of a functional TRPC3/TRPC6-Ca2+-signaling complex in polarized epithelial cells: role in apical Ca2+ influx. J Biol Chem. 2005;280:12908–12916. - PubMed
    1. Bleasdale JE, Thakur NR, Gremban RS, Bundy GL, Fitzpatrick FA, Smith RJ, Bunting S. Selective inhibition of receptor-coupled phospholipase C-dependent processes in human platelets and polymorphonuclear neutorphils. J Pharmacol Exp Ther. 1990;255:756–768. - PubMed
    1. Boulay G, Zhu X, Peyton M, Hurst R, Stefani E, Birnbaumer L. Cloning and expression of a novel mammalain homolog of Drosophila transient receptor potential (Trp) involved in calcium entry secondary to activation of receptors coupled by Gq class of G protein. J Biol Chem. 1997;272:29672–29680. - PubMed

Publication types

MeSH terms

LinkOut - more resources