

Gene expression profiling of gastric cancer by microarray combined with laser capture microdissection
- PMID: 16437709
- PMCID: PMC4725172
- DOI: 10.3748/wjg.v11.i47.7405
Gene expression profiling of gastric cancer by microarray combined with laser capture microdissection
Abstract
Aim: To examine the gene expression profile of gastric cancer (GC) by combination of laser capture microdissection (LCM) and microarray and to correlate the profiling with histological subtypes.
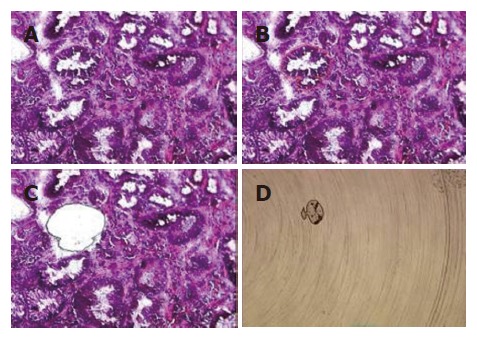
Methods: Using LCM, pure cancer cells were procured from 45 cancerous tissues. After procurement of about 5000 cells, total RNA was extracted and the quality of RNA was determined before further amplification and hybridization. One microgram of amplified RNA was converted to cDNA and hybridized to cDNA microarray.
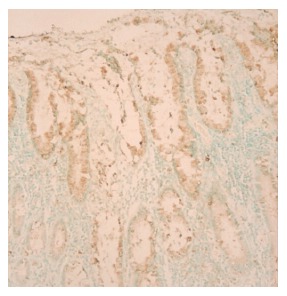
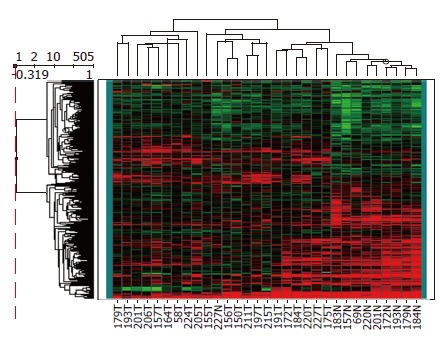
Results: Among 45 cases, only 21 were qualified for their RNAs. A total of 62 arrays were performed. These included 42 arrays for cancer (21 cases with dye-swab duplication) and 20 arrays for non-tumorous cells (10 cases with dye-swab duplication) with universal reference. Analyzed data showed 504 genes were differentially expressed and could distinguish cancerous and non-cancerous groups with more than 99% accuracy. Of the 504 genes, trefoil factors 1, 2, and 3 were in the list and their expression patterns were consistent with previous reports. Immunohistochemical staining of trefoil factor 1 was also consistent with the array data. Analyses of the tumor group with these 504 genes showed that there were 3 subgroups of GC that did not correspond to any current classification system, including Lauren's classification.
Conclusion: By using LCM, linear amplification of RNA, and cDNA microarray, we have identified a panel of genes that have the power to discriminate between GC and non-cancer groups. The new molecular classification and the identified novel genes in gastric carcinogenesis deserve further investigations to elucidate their clinicopathological significance.
Figures
Similar articles
-
Comparison of gene expression profiles between primary tumor and metastatic lesions in gastric cancer patients using laser microdissection and cDNA microarray.World J Gastroenterol. 2006 Nov 21;12(43):6949-54. doi: 10.3748/wjg.v12.i43.6949. World J Gastroenterol. 2006. PMID: 17109515 Free PMC article.
-
Distinctions in gastric cancer gene expression signatures derived from laser capture microdissection versus histologic macrodissection.BMC Med Genomics. 2011 Jun 2;4:48. doi: 10.1186/1755-8794-4-48. BMC Med Genomics. 2011. PMID: 21635755 Free PMC article.
-
Gene expression profile of salivary adenoid cystic carcinoma associated with perineural invasion.Tohoku J Exp Med. 2007 Jul;212(3):319-34. doi: 10.1620/tjem.212.319. Tohoku J Exp Med. 2007. PMID: 17592219
-
Correlating purity by microdissection with gene expression in gastric cancer tissue.Scand J Clin Lab Invest. 2007;67(4):367-79. doi: 10.1080/00365510601046334. Scand J Clin Lab Invest. 2007. PMID: 17558891 Review.
-
Laser capture microdissection, microarrays and the precise definition of a cancer cell.Expert Rev Mol Diagn. 2004 Nov;4(6):831-40. doi: 10.1586/14737159.4.6.831. Expert Rev Mol Diagn. 2004. PMID: 15525225 Review.
Cited by
-
Argininosuccinate synthetase 1 suppression and arginine restriction inhibit cell migration in gastric cancer cell lines.Sci Rep. 2015 Apr 30;5:9783. doi: 10.1038/srep09783. Sci Rep. 2015. PMID: 25928182 Free PMC article.
-
Integrated Metabolomics and Transcriptomics Analysis of Monolayer and Neurospheres from Established Glioblastoma Cell Lines.Cancers (Basel). 2021 Mar 16;13(6):1327. doi: 10.3390/cancers13061327. Cancers (Basel). 2021. PMID: 33809510 Free PMC article.
-
Identification of key genes associated with gastric cancer based on DNA microarray data.Oncol Lett. 2016 Jan;11(1):525-530. doi: 10.3892/ol.2015.3929. Epub 2015 Nov 17. Oncol Lett. 2016. PMID: 26870242 Free PMC article.
-
Identification of Metastasis-Associated MicroRNAs in Metastatic Melanoma by miRNA Expression Profile and Experimental Validation.Front Genet. 2021 Apr 9;12:663110. doi: 10.3389/fgene.2021.663110. eCollection 2021. Front Genet. 2021. PMID: 33897771 Free PMC article.
-
RAB26 and RAB3D are direct transcriptional targets of MIST1 that regulate exocrine granule maturation.Mol Cell Biol. 2010 Mar;30(5):1269-84. doi: 10.1128/MCB.01328-09. Epub 2009 Dec 28. Mol Cell Biol. 2010. PMID: 20038531 Free PMC article.
References
-
- Parkin DM, Bray FI, Devesa SS. Cancer burden in the year 2000. The global picture. Eur J Cancer. 2001;37 Suppl 8:S4–S66. - PubMed
-
- Wu MS, Lin JT, Lee WJ, Yu SC, Wang TH. [Gastric cancer in Taiwan] J Formos Med Assoc. 1994;93 Suppl 2:S77–S89. - PubMed
-
- Lin JT, Wu MS, Wang JT, Shun CT, Chen CJ, Wang TH. Clinicopathologic study of 208 patients with early gastric cancer in Taiwan: a comparison between Eastern and Western countries. J Gastroenterol Hepatol. 1994;9:344–349. - PubMed
-
- Fuchs CS, Mayer RJ. Gastric carcinoma. N Engl J Med. 1995;333:32–41. - PubMed
-
- Wright PA, Quirke P, Attanoos R, Williams GT. Molecular pathology of gastric carcinoma: progress and prospects. Hum Pathol. 1992;23:848–859. - PubMed
Publication types
MeSH terms
LinkOut - more resources
Full Text Sources
Other Literature Sources
Medical
Miscellaneous
