. 2006 Jan 25;26(4):1303-13.
doi: 10.1523/JNEUROSCI.2699-05.2006.

Synaptic vesicle protein 2 enhances release probability at quiescent synapses

Affiliations

Synaptic vesicle protein 2 enhances release probability at quiescent synapses

Kenneth L Custer et al. J Neurosci. .

Abstract

We report a thorough analysis of neurotransmission in cultured hippocampal neurons lacking synaptic vesicle protein 2 (SV2), a membrane glycoprotein present in all vesicles that undergo regulated secretion. We found that SV2 selectively enhances low-frequency neurotransmission by priming morphologically docked vesicles. Loss of SV2 reduced initial release probability during a train of action potentials but had no effect on steady-state responses. The amount and decay rate of asynchronous release, two measures sensitive to presynaptic calcium concentrations, are not altered in SV2 knock-outs, suggesting that SV2 does not act by modulating presynaptic calcium. Normal neurotransmission could be temporarily recovered by delivering an exhaustive stimulus train. Our results indicate that SV2 primes vesicles in quiescent neurons and that SV2 function can be bypassed by an activity-dependent priming mechanism. We propose that SV2 action modulates synaptic networks by ensuring that low-frequency neurotransmission is faithfully conveyed.


Figures
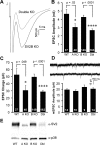
Figure 1.
Figure 1.
Excitatory responses are smaller in neurons lacking SV2A. Hippocampal neurons cultured from SV2 knock-out mice were analyzed in the whole-cell voltage-clamp configuration. Neurons were held at −60 mV, and single EPSCs were evoked by depolarizing for 1 ms. Graphs show means ± SEM. The number of cells analyzed is indicated within the bars. A, Sample traces from SV2B knock-out and SV2A/B double knock-out neurons. B, C, Average EPSC peak amplitudes (B) and total EPSC charge (C) for wild-type and SV2 knock-out neurons. Data are from littermate cultures of six WT and SV2A KO animals and 23 SV2B KO and double (Dbl) KO animals. D, Top, Representative traces of spontaneous mEPSCs recorded from SV2B and SV2A/B double knock-outs. Bottom, Mean amplitudes of mEPSCs were unchanged in wild-type and knock-out neurons. Data are from four WT, three SV2A KO, three SV2B KO, and three double KO cultures. E, Immunoblot analysis of cultured wild-type and SV2 knock-out cultures probed with anti-synaptophysin (p38) and anti-SV2 reveal that SV2A is the predominant isoform in these cultures.
Figure 2.
Figure 2.
SV2 does not control the number of functional synapses formed in culture. A, Representative SV2B and SV2A/B double knock-out neurons labeled with markers for dendrites (MAP2; green) and synapses [synaptophysin (p38); red]. B, C, Loss of SV2 does not alter the number of synapses formed per unit area (B) or per unit length (C) of dendrite. Numbers of cells analyzed are indicated within the bars. D, E, SV2B and SV2A/B double (Dbl) knock-out neurons were challenged with a hyperkalemic solution containing FM1-43FX, fixed, and processed for immunolabeling with anti-synaptophysin. D, Labeling with anti-synaptophysin (p38) indicates the total number of synapses. E, FM1-43FX labeling indicates functional synapses. F, There is no difference in the percentage of functional synapses in cultured SV2B versus SV2A/B double knock-out hippocampal neurons. The numbers of cells analyzed are indicated within the bars and represent two independent sets of littermate cultures.
Figure 3.
Figure 3.
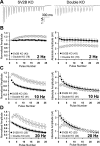
Initial and low-frequency responses are smaller in SV2A/B double knock-outs. A, Representative traces from SV2B and SV2A/B double knock-out neurons in response to trains of 25 stimuli evoked at a frequency of 10 Hz. Stimulus artifacts were removed for clarity. B–D, Left, Synaptic responses of SV2B and SV2A/B double knock-out neurons normalized to the first pulse for 2 Hz (B), 10 Hz (C), and 20 Hz (D) trains. SV2A/B double knock-outs initially exhibit facilitation and show reduced depression over the course of the trains. Shown are means ± SEM. The numbers of cells recorded from are indicated in parentheses and represent cultures from six (2 Hz), seven (10 Hz), and seven (20 Hz) sets of littermates. B–D, Right, Absolute amplitudes of responses to 2 Hz (B), 10 Hz (C), and 20 Hz (D) trains.
Figure 4.
Figure 4.
Loss of SV2 decreases synaptic release probability. To measure synaptic release probability, NMDA receptor-mediated EPSCs were evoked every 8 s in the presence of 5 μm MK-801, 10 μm CNQX, 2.5 mm calcium, and 0 mm magnesium. Amplitudes are normalized to the first response in the presence of MK-801. Data points represent mean ± SEM. The number of cells analyzed is indicated in parentheses and represent four independent sets of cultures. A, The rate of MK-801 block is reduced in SV2A/B double knock-outs relative to SV2B knock-out littermates. B, Plot of data shown in A in which the x-axis has been expanded by a factor of 35% for SV2B knock-out data. The alignment of the two curves after this manipulation indicates a decrease in the release probability in SV2A/B double knock-outs that is consistent with the decreased EPSC amplitude.
Figure 5.
Figure 5.
SV2 regulates short-term plasticity but not the calcium dependence of release. Pairs of EPSCs separated by 45 ms were evoked in wild-type and SV2 knock-out neurons at a variety of calcium concentrations with constant magnesium (1.5 mm). Data points represent mean ± SEM. The numbers of cells analyzed are indicated in parentheses. Data are from littermate cultures of three WT and SV2A KO animals and five SV2B KO and double KO animals. Asterisks denote statistically significant differences (p < 0.05). A, Representative pairs of responses in 1, 2.5, and 10 mm external calcium from SV2B and SV2A/B double knock-out cells. B, Mean normalized amplitudes of responses to a single stimulus in varying concentrations of external calcium. For each cell, EPSC amplitudes were normalized to responses in 2.5 mm calcium. Note that synaptic responses increase identically in all four genotypes as calcium is elevated. C, D, Mean paired-pulse ratios at several calcium concentrations for wild-type and SV2A knock-out (C) and SV2B and SV2A/B double knock-out (D) neurons. Paired-pulse ratios in SV2A/B double knock-outs were increased relative to SV2B knock-outs. SV2A knock-outs show an intermediate phenotype.
Figure 6.
Figure 6.
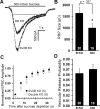
Loss of SV2 decreases the readily releasable pool of vesicles. Neurons cultured from SV2B and SV2A/B double knock-outs were bathed in hypertonic sucrose solutions to estimate the RRP. Graphs are mean ± SEM, and numbers of cells analyzed are indicated. A, Representative sucrose-evoked responses from SV2B knock-out and SV2A/B double (Dbl) knock-out neurons. The dashed lines indicate the level of steady-state release that was subtracted from charge integrals to account for on-line refilling of the RRP during sucrose application. B, Mean RRP sizes for SV2B and SV2A/B double knock-out neurons indicate that the RRP is reduced by 39% in SV2A/B double knock-outs relative to SV2B knock-outs. Data are from six independent sets of littermate cultures. C, Recovery of EPSC amplitudes after sucrose depletion of the RRP. Shown are EPSC amplitudes in response to a 0.2 Hz train initiated 2 s after sucrose application. Amplitudes are normalized to a baseline EPSC obtained before depletion of the RRP. SV2A/B double knock-out neurons show a trend toward slower recovery. Data are from two independent sets of littermate cultures. D, Mean percentage of the RRP released in response to a single action potential. EPSC charges were divided by the sucrose-induced charge to obtain vesicular release probability. To correct for response rundown, multiple EPSCs, evoked both before and 1 min after sucrose application, were averaged. Data are from six independent sets of littermate cultures.
Figure 7.
Figure 7.
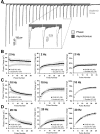
Loss of SV2 does not increase asynchronous release. Trains of 25 stimuli were evoked at 2, 10, and 20 Hz. Phasic and asynchronous components of release were determined as described in Materials and Methods. Data points represent mean ± SEM, with the number of cells analyzed indicated in parentheses. Data represent cultures from six (2 Hz), seven (10 Hz), and seven (20 Hz) sets of littermates. A, Representative trace from an SV2B knock-out neuron stimulated at 10 Hz illustrating the regions that were considered phasic release (light-shaded regions) and asynchronous release (dark-shaded regions). B–D, Left, Phasic release at 2 Hz (B), 10 Hz (C), and 20 Hz (D). Note that, for initial stimuli, phasic release is reduced in SV2A/B double knock-outs, consistent with reduced EPSC amplitudes as shown in Figures 1 and 3. B–D, Middle, Asynchronous release at 2 Hz (B), 10 Hz (C), and 20 Hz (D). Asynchronous release increased throughout the train and was similar in SV2B and SV2A/B knock-outs. Note that asynchronous release in SV2A/B double knock-outs never exceeds that of SV2B knock-outs. B–D, Right, Percentage of asynchronous release at 2 Hz (B), 10 Hz (C), and 20 Hz (D). The proportion of total release that was asynchronous was not altered at 10 and 20 Hz. At 2 Hz, SV2A/B double knock-out neurons demonstrated a small but significant increase in the proportion of asynchronous release in responses 1–8 and 12.
Figure 8.
Figure 8.
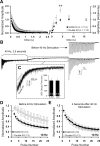
The SV2 knock-out phenotype can be transiently rescued by high-frequency stimulation. A, EPSC recovery after a depleting stimulus train. A 2.5 s, 40 Hz stimulus was used to deplete the RRP (left). At various times after depletion, a single EPSC was evoked, and its amplitude was normalized to the initial response of the depleting train (right). Note that, in contrast to EPSC recovery after sucrose depletion of the RRP, SV2A/B double knock-outs recover faster than SV2B knock-outs and exhibit robust enhancement at 4 s after depletion. Data points represent mean ± SEM, with numbers of cells analyzed indicated in parentheses. Data are from three independent sets of littermate cultures. B, Experimental protocol for C–E. The 10 Hz trains were delivered before and 4 s after depletion of the RRP. Shown is a representative response from an SV2A/B double knock-out neuron. C, Decay rates of asynchronous release are similar in SV2B and SV2A/B double knock-outs. The boxed region in B, illustrating asynchronous release after a stimulus train, was rescaled and overlaid with a representative trace from an SV2B knock-out neuron (shown in gray). The graph at the right shows mean times to 50% decay of this asynchronous release. The numbers of cells analyzed are indicated. Data represent three independent sets of littermate cultures. D, Normalized responses to a 10 Hz stimulus train delivered 1 min before 40 Hz stimulation reproduced our previous findings of reduced depression in SV2A/B double knock-out neurons. E, Normalized responses to a 10 Hz stimulus train delivered 4 s after 40 Hz stimulation. SV2A/B double knock-outs exhibit synaptic depression indistinguishable from SV2B knock-outs.
Figure 9.
Figure 9.
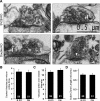
Loss of SV2 does not alter the number of morphologically docked vesicles. A, Representative electron micrographs of synapses in SV2B knock-out (top row) and SV2A/B double knock-out (bottom row) neurons. Examples of vesicles judged to be in contact with (docked) and within one vesicle diameter of the membrane are indicated with arrowheads and arrows, respectively. B–D, SV2B and SV2A/B double (Dbl) knock-out synapses have similar numbers of vesicles docked (B) or within one vesicle diameter of the plasma membrane (C). The average active zone length (D) was also similar. Data are from 59 SV2B knock-out synapses and 51 double knock-out synapses.
Figure 10.
Figure 10.
SV2 modulates a post-docking priming step. Shown is a model of the point of action of SV2 in vesicle priming. After morphological docking, vesicles undergo a series of priming events, including the formation of SNARE complexes. Our data suggest that SV2 modulates a priming step after docking and before formation of SNARE complexes. It may do this by stimulating a priming reaction (k1) or by inhibiting a depriming reaction (k−1). Calcium accumulation during repetitive stimulation can accelerate the forward (k1) reaction, temporarily compensating for loss of SV2.

Similar articles

Cited by

References

    1. Altrock WD, tom Dieck S, Sokolov M, Meyer AC, Sigler A, Brakebusch C, Fassler R, Richter K, Boeckers TM, Potschka H, Brandt C, Loscher W, Grimberg D, Dresbach T, Hempelmann A, Hassan H, Balschun D, Frey JU, Brandstatter JH, Garner CC (2003). Functional inactivation of a fraction of excitatory synapses in mice deficient for the active zone protein bassoon. Neuron 37:787–800. - PubMed
    1. Augustin I, Rosenmund C, Sudhof TC, Brose N (1999). Munc13–1 is essential for fusion competence of glutamatergic synaptic vesicles. Nature 400:457–461. - PubMed
    1. Bajjalieh S (2001). SNAREs take the stage: a prime time to trigger neurotransmitter secretion. Trends Neurosci 24:678–680. - PubMed
    1. Bekkers JM, Stevens CF (1991). Excitatory and inhibitory autaptic currents in isolated hippocampal neurons maintained in cell culture. Proc Natl Acad Sci USA 88:7834–7838. - PMC - PubMed
    1. Blatow M, Caputi A, Burnashev N, Monyer H, Rozov A (2003). Ca2+ buffer saturation underlies paired pulse facilitation in calbindin-D28k-containing terminals. Neuron 38:79–88. - PubMed

Publication types

MeSH terms