. 2006 Jan 23;203(1):227-38.
doi: 10.1084/jem.20051645. Epub 2006 Jan 17.

Activation of the Flt3 signal transduction cascade rescues and enhances type I interferon-producing and dendritic cell development

Affiliations

Activation of the Flt3 signal transduction cascade rescues and enhances type I interferon-producing and dendritic cell development

Nobuyuki Onai et al. J Exp Med. .

Abstract

Flt3 ligand (Flt3L) is a nonredundant cytokine in type I interferon-producing cell (IPC) and dendritic cell (DC) development, and IPC and DC differentiation potential is confined to Flt3+ hematopoietic progenitor cells. Here, we show that overexpression of human Flt3 in Flt3- (Flt3(-)Lin(-)IL-7Ralpha(-)Thy1.1(-)c-Kit+) and Flt3+ (Flt3(+)Lin(-)IL-7Ralpha(-)Thy1.1(-)c-Kit+) hematopoietic progenitors rescues and enhances their IPC and DC differentiation potential, respectively. In defined hematopoietic cell populations, such as Flt3- megakaryocyte/erythrocyte-restricted progenitors (MEPs), enforced Flt3 signaling induces transcription of IPC, DC, and granulocyte/macrophage (GM) development-affiliated genes, including STAT3, PU.1, and G-/M-/GM-CSFR, and activates differentiation capacities to these lineages. Moreover, ectopic expression of Flt3 downstream transcription factors STAT3 or PU.1 in Flt3- MEPs evokes Flt3 receptor expression and instructs differentiation into IPCs, DCs, and myelomonocytic cells, whereas GATA-1 expression and consecutive megakaryocyte/erythrocyte development is suppressed. Based on these data, we propose a demand-regulated, cytokine-driven DC and IPC regeneration model, in which high Flt3L levels initiate a self-sustaining, Flt3-STAT3- and Flt3-PU.1-mediated IPC and DC differentiation program in Flt3+ hematopoietic progenitor cells.


Figures
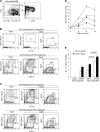
Figure 1.
Figure 1.
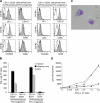
Enforced expression of human Flt3 in Flt3 and Flt3+ progenitors rescues and enhances IPC and DC developmental potential, respectively. (A) Contour plots indicate sorting gates for mouse bone marrow, c-Kit–enriched Flt3LinIL-7RαThy1.1c-Kit+ (Flt3 progenitors), and Flt3+LinIL-7RαThy1.1c-Kit+ (Flt3+ progenitors) cells. (B) Flow cytometric analysis of GFP+ cells derived from control-GFP– and huFlt3-GFP–transduced Flt3 progenitors cultured for 4 or 8 d in huFlt3L-Ig– and SCF-supplemented media. (C) Flow cytometric analysis of GFP+ cells derived from control-GFP– and huFlt3-GFP–transduced Flt3+ progenitors cultured for 4 or 8 d in huFlt3L-Ig– and SCF-supplemented media. (B and C) Numbers at gates represent percentages of total plotted cells. Results are from one representative experiment out of six each. (D) Graph depicts numbers of cells derived from 105 retrovirus-transduced progenitor cells cultured with huFlt3L-Ig and SCF at days 4, 8, and 12 of culture. ▪, GFP-transduced Flt3 progenitors; •, huFlt3-transduced Flt3 progenitors; ⋄, GFP-transduced Flt3+ progenitors; △, huFlt3-transduced Flt3+ progenitors. Each point represents mean values ± SD from three independent experiments. (E) Bars show total IPC (CD11c+B220+) and DC (CD11c+B220) yields per 105 retrovirus-transduced progenitor cells at day 8. The data represents mean values ± SD from three independent experiments. Statistical analysis was performed by Student's t test.
Figure 2.
Figure 2.
IPCs and DCs developed in culture from huFlt3-transduced Flt3 progenitors are functional. (A) Contour plots indicate surface markers (closed histogram) and respective isotype controls (open histogram) on CD11c+B220+ and CD11c+B220 cells derived from huFlt3L-Ig– and SCF-cultured huFlt3-transduced Flt3 progenitors. CD11c+B220+ and CD11c+B220 cells show typical phenotypes of IPCs and DCs, respectively. Results are from one representative experiment out of three. (B) Sorted CD11c+B220+ IPCs but not CD11c+B220 DCs, both derived from either huFlt3-transduced Flt3 progenitors or GFP-transduced Flt3+ progenitors, produce IFN-α upon influenza virus or CpG stimulation. Culture supernatants were collected after 24 h and analyzed by ELISA. Results are from one representative experiment out of three. (C) About half of day 8 progeny from huFlt3-transduced Flt3 progenitors display typical DC morphology. Giemsa-stained cytospin, photographed at a magnification of 40. (D) In vitro–generated CD11c+B220 cells from retrovirus-transduced progenitors are efficient stimulators of allogeneic T cells. Graph depicts thymidine incorporation of 2 × 10⁵ allogeneic BALB/c spleen CD4+ T cells incubated with graded numbers (x axis) of sorted CD11c+B220 DCs derived from huFlt3-transduced Flt3 progenitors (•), CD11c+B220+ IPCs derived from huFlt3-transduced Flt3 progenitors (▪), or CD11c+B220 DCs derived from GFP-transduced Flt3+ progenitors (△), and CD11c+B220+ IPCs derived from GFP-transduced Flt3+ progenitors (⋄). Results are from one representative experiment out of three.
Figure 3.
Figure 3.
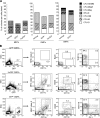
Enforced expression of huFlt3 is sufficient to rescue IPC and DC development from MEPs and enhances IPC and DC development from GMPs. (A and B) Flow cytometric analysis of GFP+ cells from control-GFP– and huFlt3-transduced MEPs (A) and GMPs (B). Retrovirus-transduced cells were cultured for 4 or 8 d in huFlt3L-Ig– and SCF-supplemented media. Numbers at gates represent percentages of total plotted cells. Results are from one representative experiment out of three. (C) Bars show total IPC (CD11c+B220+) and DC (CD11c+B220) yields per 5 × 10⁴ retrovirus-transduced MEPs, GMPs, and CMPs at day 8. The data represents mean values ± SD from three independent experiments. Statistical analysis was performed by Student's t test. (D) IPCs developed from huFlt3 +-MEPs and huFlt3 +-GMPs are functional. Bar graph shows IFN-α production by sorted CD11c+B220+ cells derived from day 8 culture of huFlt3 +-MEPs or huFlt3 +-GMPs stimulated with influenza virus or CpG. Culture supernatants were collected after 24 h and analyzed by ELISA. Results are from one representative experiment out of three.
Figure 4.
Figure 4.
Enforced expression of huFlt3 permits myelomonocytic development from huFlt3+-MEPs but not megakaryocyte/erythrocyte development from huFlt3+-GMPs. (A) Bar graph shows myeloid colony–forming activity in normal and retrovirus-transduced myeloid progenitors (MEPs, GMPs, and CMPs). CFU-GEMM, CFU-granulocyte/erythroid/macrophage/megakaryocyte; CFU-MegE, CFU-megakaryocyte/erythroid; CFU-Meg, CFU-megakaryocyte; BFU-E, burst-forming units/erythroid; CFU-GM, CFU-granulocyte/macrophage; CFU-M, CFU-macrophage; CFU-G, CFU-granulocyte. Results are from one representative experiment out of three. 200 GFP+ cells were plated each. (B) Enforced expression of huFlt3 in MEPs is sufficient to rescue IPC, DC, and myelomonocytic cell development in vivo. Contour plots show GFP expression in day 7 spleen progeny of GFP +-MEPs, huFlt3 +-MEPs, and GFP +-CMPs. Numbers at gates represent percentages of total plotted cells. Results are from one representative experiment out of four.
Figure 5.
Figure 5.
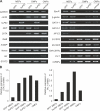
HuFlt3 signaling in MEPs induces activation of DC and myeloid development–associated genes. (A) RT-PCR analysis of myeloid lineage differentiation–affiliated genes, including cytokine receptors and transcription factors in retrovirus-transduced myeloid progenitors. The PCR products were electrophoresed on agarose gel and visualized with ethidium bromide. Results are from one representative experiment out of three. (B) Expression levels of STAT3 and PU.1 mRNA were assessed by real-time RT-PCR. Data were normalized by the level of 18s rRNA expression in each sample. (A and B) cDNA products equivalent to RNAs from 200 progenitors were analyzed. Results are from one representative experiment out of three.
Figure 6.
Figure 6.
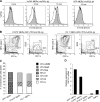
HuFlt3 signaling in MEPs leads to downstream STAT3 phosphorylation; enforced STAT3 or PU.1 expression instructs MEPs to differentiate into IPCs, DCs, and GM lineage cells and suppresses GATA-1 expression. (A) Contour plots show phosho-STAT3 expression (closed histogram) and respective isotype controls (open histogram) in cytokine-deprived and consecutively 5- and 15-min huFlt3L-Ig–stimulated huFlt3 +-MEPs by intracellular staining. Results are from one representative experiment out of three. (B) Flow cytometric analysis of STAT3 +-MEPs and PU.1 +-MEPs cultured for 8 d in huFlt3L-Ig–, SCF-, and TPO-supplemented media. Results are from one representative experiment out of three. (C) Bar graph shows myeloid colony–forming activity in GFP +-MEPs, STAT3 +-MEPs, and PU.1 +-MEPs. Results are from one representative experiment out of three. (D) Expression of GATA-1 mRNA was assessed by real-time RT-PCR. Data were normalized by the level of 18s rRNA expression in each sample. cDNA products equivalent to RNAs from 200 progenitors were analyzed. Results are from one representative experiment out of three.

Similar articles

Cited by

References

    1. Kondo, M., A.J. Wagers, M.G. Manz, S.S. Prohaska, D.C. Scherer, G.F. Beilhack, J.A. Shizuru, and I.L. Weissman. 2003. Biology of hematopoietic stem cells and progenitors: implications for clinical application. Annu. Rev. Immunol. 21:759–806. - PubMed
    1. Akashi, K., D. Traver, T. Miyamoto, and I.L. Weissman. 2000. A clonogenic common myeloid progenitor that gives rise to all myeloid lineages. Nature. 404:193–197. - PubMed
    1. Manz, M.G., T. Miyamoto, K. Akashi, and I.L. Weissman. 2002. Prospective isolation of human clonogenic common myeloid progenitors. Proc. Natl. Acad. Sci. USA. 99:11872–11877. - PMC - PubMed
    1. Galy, A., M. Travis, D. Cen, and B. Chen. 1995. Human T, B, natural killer, and dendritic cells arise from a common bone marrow progenitor cell subset. Immunity. 3:459–473. - PubMed
    1. Kondo, M., I.L. Weissman, and K. Akashi. 1997. Identification of clonogenic common lymphoid progenitors in mouse bone marrow. Cell. 91:661–672. - PubMed

Publication types

MeSH terms