

Balanced excitation and inhibition determine spike timing during frequency adaptation
- PMID: 16407542
- PMCID: PMC6674406
- DOI: 10.1523/JNEUROSCI.3506-05.2006
Balanced excitation and inhibition determine spike timing during frequency adaptation
Abstract
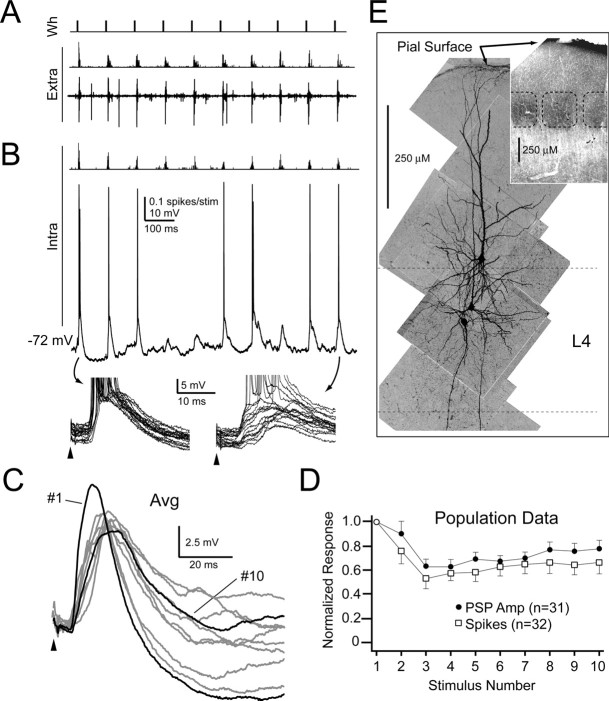
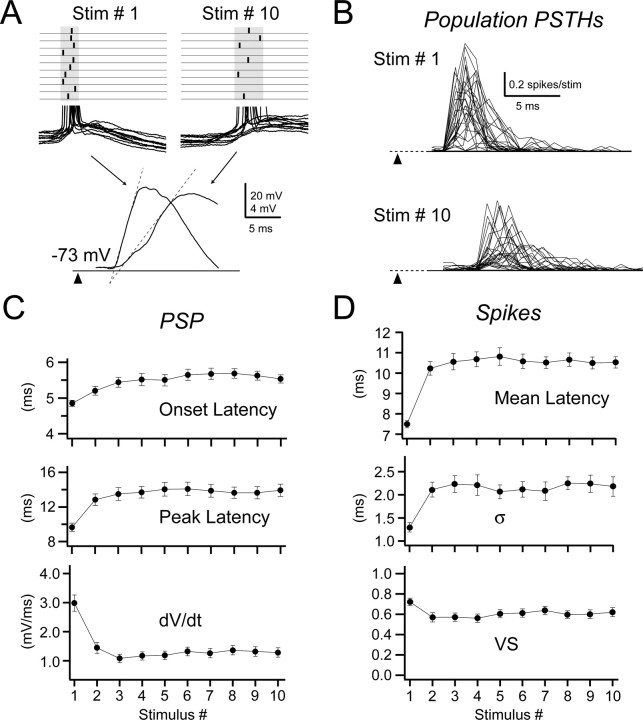
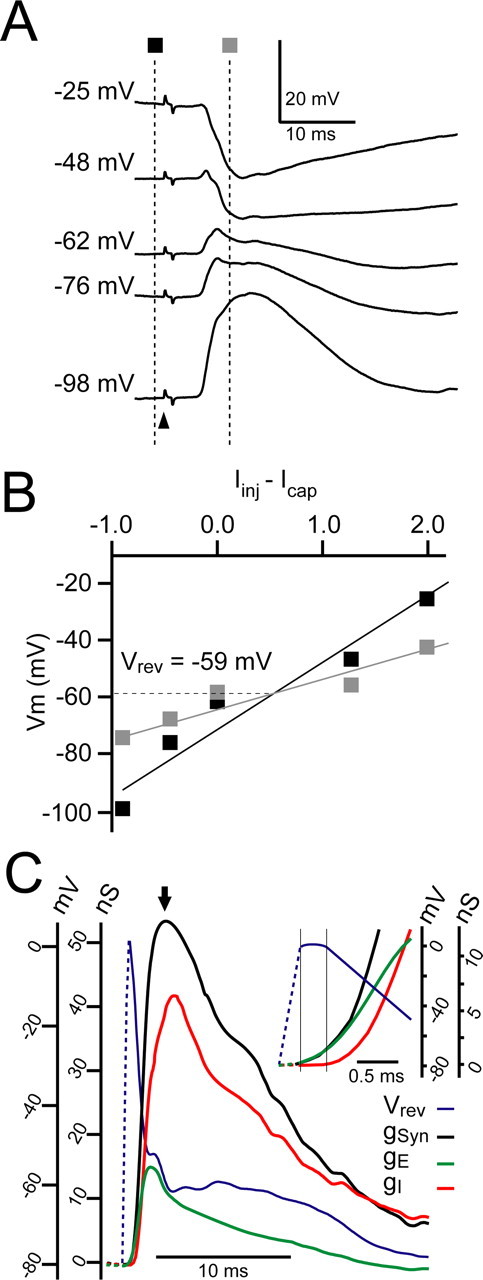
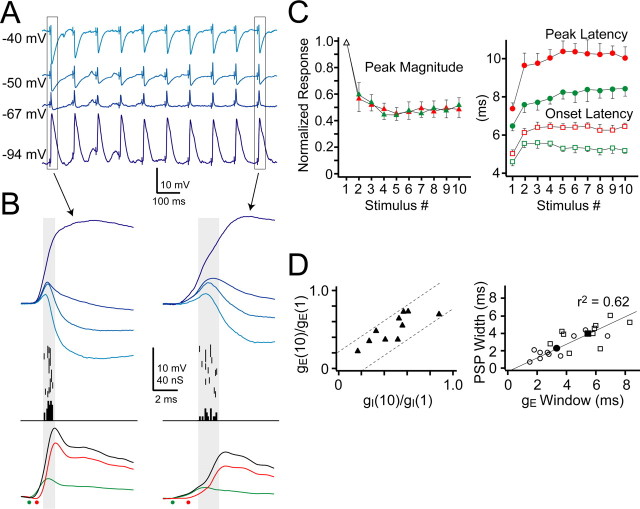
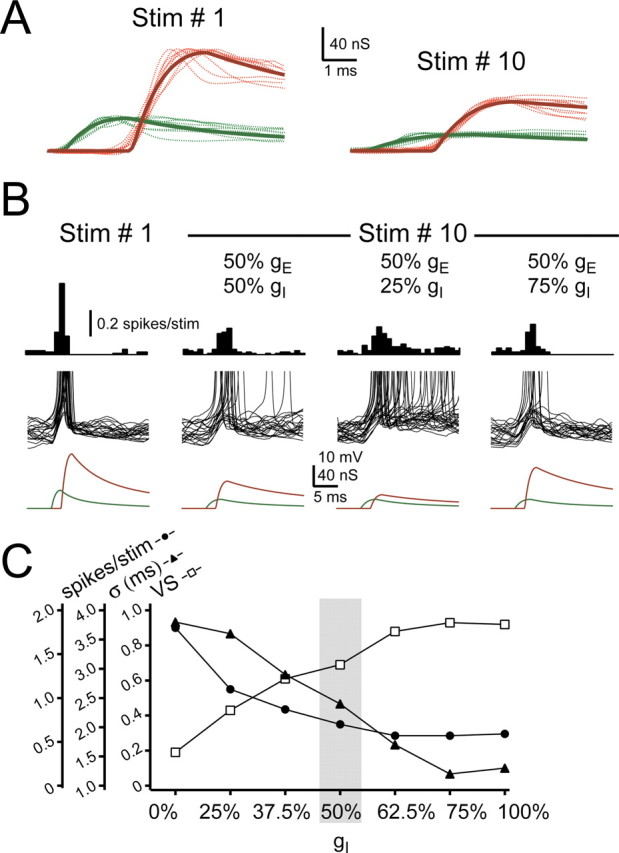
In layer 4 (L4) of the rat barrel cortex, a single whisker deflection evokes a stereotyped sequence of excitation followed by inhibition, hypothesized to result in a narrow temporal window for spike output. However, awake rats sweep their whiskers across objects, activating the cortex at frequencies known to induce short-term depression at both excitatory and inhibitory synapses within L4. Although periodic whisker deflection causes a frequency-dependent reduction of the cortical response magnitude, whether this adaptation involves changes in the relative balance of excitation and inhibition and how these changes might impact the proposed narrow window of spike timing in L4 is unknown. Here, we demonstrate for the first time that spike output in L4 is determined precisely by the dynamic interaction of excitatory and inhibitory conductances. Furthermore, we show that periodic whisker deflection results in balanced adaptation of the magnitude and timing of excitatory and inhibitory input to L4 neurons. This balanced adaptation mediates a reduction in spike output while preserving the narrow time window of spike generation, suggesting that L4 circuits are calibrated to maintain relative levels of excitation and inhibition across varying magnitudes of input.
Figures
Similar articles
-
Shift in the balance between excitation and inhibition during sensory adaptation of S1 neurons.J Neurosci. 2008 Dec 3;28(49):13320-30. doi: 10.1523/JNEUROSCI.2646-08.2008. J Neurosci. 2008. PMID: 19052224 Free PMC article.
-
Intrinsic firing patterns and whisker-evoked synaptic responses of neurons in the rat barrel cortex.J Neurophysiol. 1999 Mar;81(3):1171-83. doi: 10.1152/jn.1999.81.3.1171. J Neurophysiol. 1999. PMID: 10085344
-
Adaptation in thalamic barreloid and cortical barrel neurons to periodic whisker deflections varying in frequency and velocity.J Neurophysiol. 2004 Dec;92(6):3244-54. doi: 10.1152/jn.00257.2004. Epub 2004 Aug 11. J Neurophysiol. 2004. PMID: 15306632
-
Spike timing and synaptic dynamics at the awake thalamocortical synapse.Prog Brain Res. 2005;149:91-105. doi: 10.1016/S0079-6123(05)49008-1. Prog Brain Res. 2005. PMID: 16226579 Review.
-
Population coding in somatosensory cortex.Curr Opin Neurobiol. 2002 Aug;12(4):441-7. doi: 10.1016/s0959-4388(02)00338-0. Curr Opin Neurobiol. 2002. PMID: 12139993 Review.
Cited by
-
Signaling between periglomerular cells reveals a bimodal role for GABA in modulating glomerular microcircuitry in the olfactory bulb.Proc Natl Acad Sci U S A. 2015 Jul 28;112(30):9478-83. doi: 10.1073/pnas.1424406112. Epub 2015 Jul 13. Proc Natl Acad Sci U S A. 2015. PMID: 26170298 Free PMC article.
-
On the relationship between GABA+ and glutamate across the brain.Neuroimage. 2022 Aug 15;257:119273. doi: 10.1016/j.neuroimage.2022.119273. Epub 2022 May 5. Neuroimage. 2022. PMID: 35526748 Free PMC article.
-
Stimulus dependence of barrel cortex directional selectivity.PLoS One. 2006 Dec 27;1(1):e137. doi: 10.1371/journal.pone.0000137. PLoS One. 2006. PMID: 17205141 Free PMC article.
-
Orientation selectivity of synaptic input to neurons in mouse and cat primary visual cortex.J Neurosci. 2011 Aug 24;31(34):12339-50. doi: 10.1523/JNEUROSCI.2039-11.2011. J Neurosci. 2011. PMID: 21865476 Free PMC article.
-
Response Adaptation in Barrel Cortical Neurons Facilitates Stimulus Detection during Rhythmic Whisker Stimulation in Anesthetized Mice.eNeuro. 2019 Apr 2;6(2):ENEURO.0471-18.2019. doi: 10.1523/ENEURO.0471-18.2019. eCollection 2019 Mar-Apr. eNeuro. 2019. PMID: 30957014 Free PMC article.
References
-
- Abbott LF, Varela JA, Sen K, Nelson SB (1997) Synaptic depression and cortical gain control. Science 275: 220–224. - PubMed
-
- Agmon A, Connors BW (1991) Thalamocortical responses of mouse somatosensory (barrel) cortex in vitro. Neuroscience 41: 365–379. - PubMed
-
- Ahissar E, Arieli A (2001) Figuring space by time. Neuron 32: 185–201. - PubMed
-
- Ahissar E, Sosnik R, Haidarliu S (2000) Transformation from temporal to rate coding in a somatosensory thalamocortical pathway. Nature 406: 302–306. - PubMed
-
- Ahissar E, Sosnik R, Bagdasarian K, Haidarliu S (2001) Temporal frequency of whisker movement. II. Laminar organization of cortical representations. J Neurophysiol 86: 354–367. - PubMed
Publication types
MeSH terms
LinkOut - more resources
Full Text Sources
Other Literature Sources