. 2006 Jan;24(1):55-62.
doi: 10.1038/nbt1150.

Creation and implications of a phenome-genome network

Affiliations

Creation and implications of a phenome-genome network

Atul J Butte et al. Nat Biotechnol. 2006 Jan.

Abstract

Although gene and protein measurements are increasing in quantity and comprehensiveness, they do not characterize a sample's entire phenotype in an environmental or experimental context. Here we comprehensively consider associations between components of phenotype, genotype and environment to identify genes that may govern phenotype and responses to the environment. Context from the annotations of gene expression data sets in the Gene Expression Omnibus is represented using the Unified Medical Language System, a compendium of biomedical vocabularies with nearly 1-million concepts. After showing how data sets can be clustered by annotative concepts, we find a network of relations between phenotypic, disease, environmental and experimental contexts as well as genes with differential expression associated with these concepts. We identify novel genes related to concepts such as aging. Comprehensively identifying genes related to phenotype and environment is a step toward the Human Phenome Project.


Figures

Figure 1
Figure 1
The method of extracting and relating genome, phenome and envirome data from GEO data sets. Step 1: seven fields of annotations representing the phenotype, environmental and experimental context from GEO samples, series, and data sets are parsed and mapped to UMLS concepts. Step 2: GEO platforms are manually related to LocusLink identifiers, allowing the same genes to be related across platforms. Step 3: gene expression measurements are rank-normalized within each GEO sample, then averaged across each GEO series. Step 4: mean expression measurements for each gene in each GEO data set were related to the concepts mapped from each GEO data set.
Figure 2
Figure 2
Hierarchical clustering of 448 GEO data sets by context, created by treating each as data set as a vector representing the presence or absence of a mapping from that data set to each UMLS concept, then calculating binary distance between data sets and clustering using complete linkage. (a) A total of 6,612 samples are represented in these data sets. The numeral 1 indicates a cluster with 33 data sets, all from the Alliance for Cellular Signaling, with almost identical experimental methods. (b) A magnified view of the cluster indicated by numeral 2 is shown. Numbers to the right of data set titles indicate GDS accession numbers. Within the cluster, muscle samples studied with respect to aging cluster together. Samples from inflammatory myopathy, muscular dystrophy, and dermatomyositis also cluster together. The 19 data sets in this cluster were contributed to GEO by three different submitters.
Figure 2
Figure 2
Hierarchical clustering of 448 GEO data sets by context, created by treating each as data set as a vector representing the presence or absence of a mapping from that data set to each UMLS concept, then calculating binary distance between data sets and clustering using complete linkage. (a) A total of 6,612 samples are represented in these data sets. The numeral 1 indicates a cluster with 33 data sets, all from the Alliance for Cellular Signaling, with almost identical experimental methods. (b) A magnified view of the cluster indicated by numeral 2 is shown. Numbers to the right of data set titles indicate GDS accession numbers. Within the cluster, muscle samples studied with respect to aging cluster together. Samples from inflammatory myopathy, muscular dystrophy, and dermatomyositis also cluster together. The 19 data sets in this cluster were contributed to GEO by three different submitters.
Figure 3
Figure 3
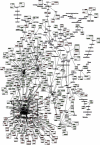
Network of relations between 46 biomedical concepts extracted from the annotations of data sets in Gene Expression Omnibus and 444 genes with differential expression associated with the presence or absence of the concept. (a) Light blue nodes are UMLS concepts. Pink nodes are genes with higher expression levels in data sets annotated with their related concept; light green nodes are genes with lower expression levels in annotated data sets. Pink and green nodes are contained within gray squares indicating ortholog families. Edges (dashed) between an ortholog family and concept indicate statistically significant relations between that concept and each included gene. The remaining edges (solid arrows) indicate existing hierarchical relations between UMLS concepts. (b) Muscle Cells and three related concepts were among the most highly connected concepts, and relate to increased Myh6, Mybpc1, Mybph, Tnni1, and other genes. (c) Of the human genes related to Muscle Cells, Pdlim3 shows the greatest differential expression. There is a significant increase in the normalized expression of Pdlim3 in the 8 data sets annotated with Muscle Cells (dark shaded bars) compared with the 34 data sets without (light shaded bars). X-axis labels indicate GEO data set numbers. (d) A similar significant pattern of association with Muscle Cells is seen with mouse Pdlim3.
Figure 3
Figure 3
Network of relations between 46 biomedical concepts extracted from the annotations of data sets in Gene Expression Omnibus and 444 genes with differential expression associated with the presence or absence of the concept. (a) Light blue nodes are UMLS concepts. Pink nodes are genes with higher expression levels in data sets annotated with their related concept; light green nodes are genes with lower expression levels in annotated data sets. Pink and green nodes are contained within gray squares indicating ortholog families. Edges (dashed) between an ortholog family and concept indicate statistically significant relations between that concept and each included gene. The remaining edges (solid arrows) indicate existing hierarchical relations between UMLS concepts. (b) Muscle Cells and three related concepts were among the most highly connected concepts, and relate to increased Myh6, Mybpc1, Mybph, Tnni1, and other genes. (c) Of the human genes related to Muscle Cells, Pdlim3 shows the greatest differential expression. There is a significant increase in the normalized expression of Pdlim3 in the 8 data sets annotated with Muscle Cells (dark shaded bars) compared with the 34 data sets without (light shaded bars). X-axis labels indicate GEO data set numbers. (d) A similar significant pattern of association with Muscle Cells is seen with mouse Pdlim3.
Figure 4
Figure 4
Example relations between genes and phenotypes and environment. (a) The mean normalized expression level of human H6pd is higher in the 4 data sets annotated with Aging (dark shaded bars) compared with the 35 data sets without (light shaded bars). X-axis labels indicate GEO data set numbers. (b) An opposite pattern is seen in the relation between Aging and human Bdnf. (c) Human Ddx24 is lower in GEO data sets annotated with Leukemia. (e) Mouse Gpx3 and (f) Mapk14 both shown a significant increase in expression in data sets with an annotation mapped to the concept Injury.
Figure 4
Figure 4
Example relations between genes and phenotypes and environment. (a) The mean normalized expression level of human H6pd is higher in the 4 data sets annotated with Aging (dark shaded bars) compared with the 35 data sets without (light shaded bars). X-axis labels indicate GEO data set numbers. (b) An opposite pattern is seen in the relation between Aging and human Bdnf. (c) Human Ddx24 is lower in GEO data sets annotated with Leukemia. (e) Mouse Gpx3 and (f) Mapk14 both shown a significant increase in expression in data sets with an annotation mapped to the concept Injury.

Similar articles

Cited by

References

    1. Carson JP, et al. Pharmacogenomic identification of targets for adjuvant therapy with the topoisomerase poison camptothecin. Cancer Res. 2004;64:2096–104. - PubMed
    1. Zhukov TA, Johanson RA, Cantor AB, Clark RA, Tockman MS. Discovery of distinct protein profiles specific for lung tumors and pre-malignant lung lesions by SELDI mass spectrometry. Lung Cancer. 2003;40:267–79. - PubMed
    1. Bhattacharjee A, et al. Classification of human lung carcinomas by mRNA expression profiling reveals distinct adenocarcinoma subclasses. Proc Natl Acad Sci U S A. 2001;98:13790–5. - PMC - PubMed
    1. Yanagisawa K, et al. Proteomic patterns of tumour subsets in non-small-cell lung cancer. Lancet. 2003;362:433–9. - PubMed
    1. Freimer N, Sabatti C. The human phenome project. Nat Genet. 2003;34:15–21. - PubMed

Publication types

Substances

LinkOut - more resources