

High-dimensional and large-scale phenotyping of yeast mutants
- PMID: 16365294
- PMCID: PMC1316885
- DOI: 10.1073/pnas.0509436102
High-dimensional and large-scale phenotyping of yeast mutants
Abstract
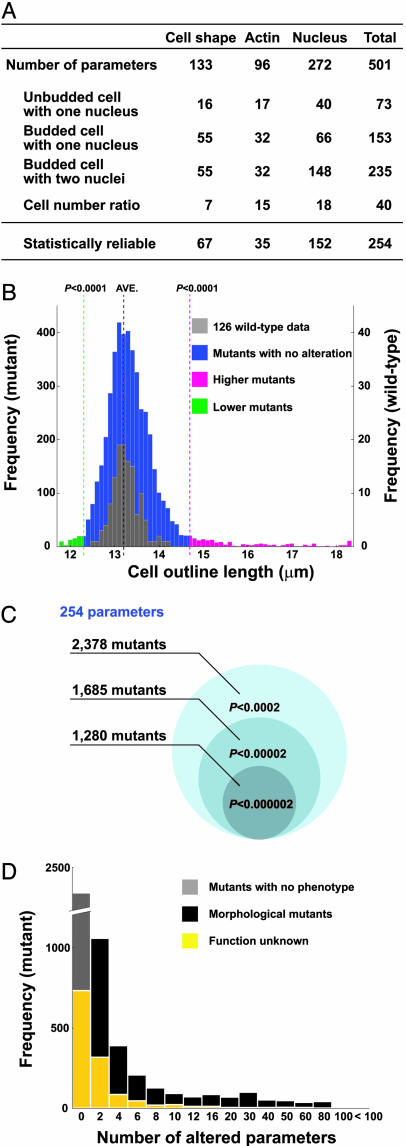
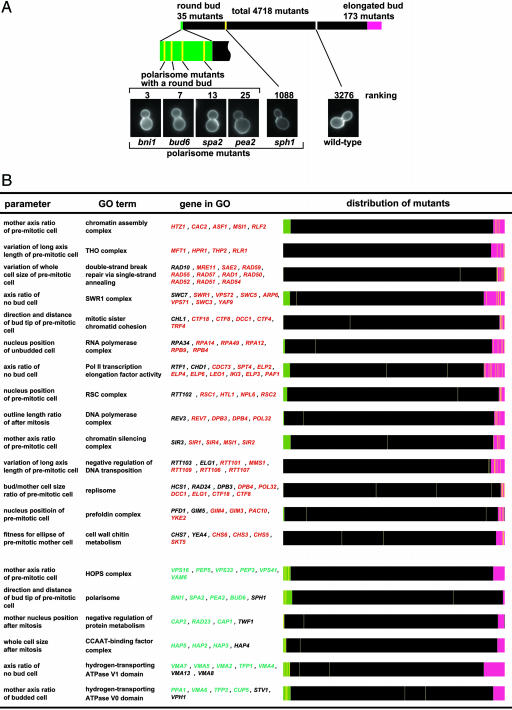
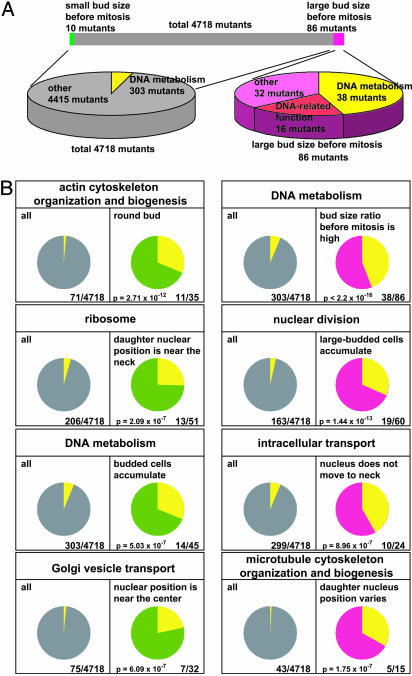
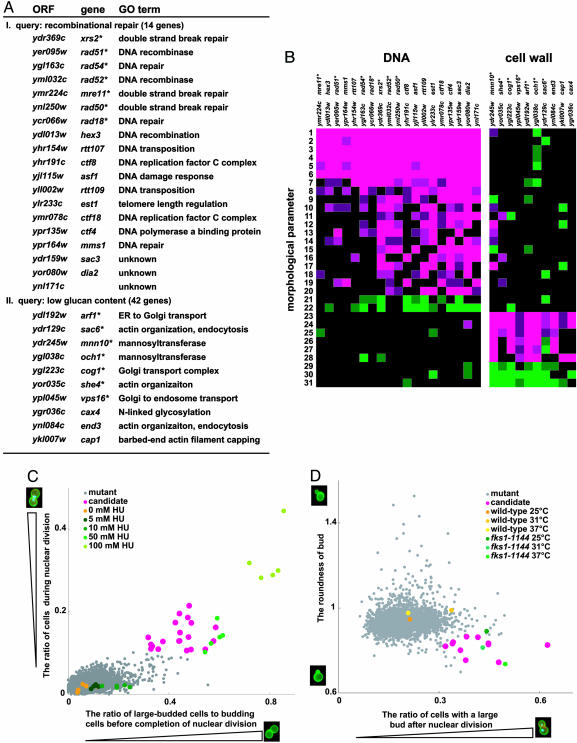
One of the most powerful techniques for attributing functions to genes in uni- and multicellular organisms is comprehensive analysis of mutant traits. In this study, systematic and quantitative analyses of mutant traits are achieved in the budding yeast Saccharomyces cerevisiae by investigating morphological phenotypes. Analysis of fluorescent microscopic images of triple-stained cells makes it possible to treat morphological variations as quantitative traits. Deletion of nearly half of the yeast genes not essential for growth affects these morphological traits. Similar morphological phenotypes are caused by deletions of functionally related genes, enabling a functional assignment of a locus to a specific cellular pathway. The high-dimensional phenotypic analysis of defined yeast mutant strains provides another step toward attributing gene function to all of the genes in the yeast genome.
Figures
Similar articles
-
Large-scale analysis of the yeast genome by transposon tagging and gene disruption.Nature. 1999 Nov 25;402(6760):413-8. doi: 10.1038/46558. Nature. 1999. PMID: 10586881
-
Large-scale phenotypic analysis--the pilot project on yeast chromosome III.Yeast. 1997 Dec;13(16):1547-62. doi: 10.1002/(SICI)1097-0061(199712)13:16<1547::AID-YEA230>3.0.CO;2-Y. Yeast. 1997. PMID: 9509574
-
Functional genomics: lessons from yeast.Philos Trans R Soc Lond B Biol Sci. 2002 Jan 29;357(1417):17-23. doi: 10.1098/rstb.2001.1049. Philos Trans R Soc Lond B Biol Sci. 2002. PMID: 11839178 Free PMC article.
-
[Decade of genomics--methods for genome investigation in yeast Saccharomyces cerevisiae].Postepy Biochem. 2006;52(4):435-47. Postepy Biochem. 2006. PMID: 17536513 Review. Polish.
-
Large-scale mutagenesis and functional genomics in yeast.Funct Integr Genomics. 2002 Sep;2(4-5):193-8. doi: 10.1007/s10142-002-0057-3. Epub 2002 May 9. Funct Integr Genomics. 2002. PMID: 12192592 Review.
Cited by
-
Extent and context dependence of pleiotropy revealed by high-throughput single-cell phenotyping.PLoS Biol. 2020 Aug 17;18(8):e3000836. doi: 10.1371/journal.pbio.3000836. eCollection 2020 Aug. PLoS Biol. 2020. PMID: 32804946 Free PMC article.
-
Intra- and Interspecies Variability of Single-Cell Innate Fluorescence Signature of Microbial Cell.Appl Environ Microbiol. 2019 Aug 29;85(18):e00608-19. doi: 10.1128/AEM.00608-19. Print 2019 Sep 15. Appl Environ Microbiol. 2019. PMID: 31324624 Free PMC article.
-
High-content, image-based screening for drug targets in yeast.PLoS One. 2010 Apr 14;5(4):e10177. doi: 10.1371/journal.pone.0010177. PLoS One. 2010. PMID: 20418956 Free PMC article.
-
Capturing Single-Cell Phenotypic Variation via Unsupervised Representation Learning.Proc Mach Learn Res. 2019 Jul;103:315-325. Proc Mach Learn Res. 2019. PMID: 35874600 Free PMC article.
-
Global study of holistic morphological effectors in the budding yeast Saccharomyces cerevisiae.BMC Genomics. 2018 Feb 20;19(1):149. doi: 10.1186/s12864-018-4526-z. BMC Genomics. 2018. PMID: 29458326 Free PMC article.
References
-
- Winzeler, E. A., Shoemaker, D. D., Astromoff, A., Liang, H., Anderson, K., Andre, B., Bangham, R., Benito, R., Boeke, J. D., Bussey, H., et al. (1999) Science 285, 901-906. - PubMed
-
- Bader, G. D., Heilbut, A., Andrews, B., Tyers, M., Hughes, T. & Boone, C. (2003) Trends Cell Biol. 13, 344-356. - PubMed
-
- Giaever, G., Chu, A. M., Ni, L., Connelly, C., Riles, L., Veronneau, S., Dow, S., Lucau-Danila, A., Anderson, K., Andre, B., et al. (2002) Nature 418, 387-391. - PubMed
-
- Jorgensen, P., Nishikawa, J. L., Breitkreutz, B. J. & Tyers, M. (2002) Science 297, 395-400. - PubMed
-
- Zhang, J., Schneider, C., Ottmers, L., Rodriguez, R., Day, A., Markwardt, J. & Schneider, B. L. (2002) Curr. Biol. 12, 1992-2001. - PubMed
Publication types
MeSH terms
Substances
LinkOut - more resources
Full Text Sources
Other Literature Sources
Molecular Biology Databases
