Structural genomics analysis of alternative splicing and application to isoform structure modeling
- PMID: 16354838
- PMCID: PMC1323168
- DOI: 10.1073/pnas.0506770102
Structural genomics analysis of alternative splicing and application to isoform structure modeling
Abstract
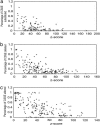
Alternative splicing is a sophisticated nuclear process that regulates gene expression. It represents an important mechanism for enhancing the functional diversity of proteins. Our current knowledge of alternatively spliced variants is derived mainly from mRNA transcripts, and very little is known about their protein tertiary structures. We carried out a large-scale analysis of known alternatively spliced variants at both protein sequence and structure levels and have shown that threading is, in general, a viable approach for modeling structures of alternatively spliced variants. An examination of alternative splicing at the protein sequence level revealed that the size of splicing events follows the power law distribution and the majority of splicing isoforms harbor only one or two alternations. We examined alternative splicing in the context of protein 3D structures and found that the boundaries of alternative splicing events generally happen in coil regions of secondary structures and exposed residues and the majority of the sequences involved in splicing are located on the surface of proteins. In light of these findings, we then proceeded to demonstrate that threading represents a useful tool for structure prediction of alternative splicing isoforms and addressed the fold stability issue of threading-based structure prediction by molecular dynamics simulation. Our analysis and the insights gained have helped to establish a viable method for structure prediction of alternatively spliced isoforms at the genome scale.
Figures


Similar articles
-
Alternative splicing in human transcriptome: functional and structural influence on proteins.Gene. 2006 Oct 1;380(2):63-71. doi: 10.1016/j.gene.2006.05.015. Epub 2006 Jun 2. Gene. 2006. PMID: 16872759
-
Integrating alternative splicing detection into gene prediction.BMC Bioinformatics. 2005 Feb 10;6:25. doi: 10.1186/1471-2105-6-25. BMC Bioinformatics. 2005. PMID: 15705189 Free PMC article.
-
Changes in alternative splicing of human and mouse genes are accompanied by faster evolution of constitutive exons.Mol Biol Evol. 2005 Nov;22(11):2198-208. doi: 10.1093/molbev/msi218. Epub 2005 Jul 27. Mol Biol Evol. 2005. PMID: 16049198
-
Structural and functional diversity generated by alternative mRNA splicing.Trends Biochem Sci. 2005 Sep;30(9):515-21. doi: 10.1016/j.tibs.2005.07.001. Trends Biochem Sci. 2005. PMID: 16023350 Review.
-
Increase of functional diversity by alternative splicing.Trends Genet. 2003 Mar;19(3):124-8. doi: 10.1016/S0168-9525(03)00023-4. Trends Genet. 2003. PMID: 12615003 Review.
Cited by
-
Protein structure prediction: when is it useful?Curr Opin Struct Biol. 2009 Apr;19(2):145-55. doi: 10.1016/j.sbi.2009.02.005. Epub 2009 Mar 25. Curr Opin Struct Biol. 2009. PMID: 19327982 Free PMC article. Review.
-
Exon-level microarray analyses identify alternative splicing programs in breast cancer.Mol Cancer Res. 2010 Jul;8(7):961-74. doi: 10.1158/1541-7786.MCR-09-0528. Epub 2010 Jul 6. Mol Cancer Res. 2010. PMID: 20605923 Free PMC article.
-
Comparative analysis indicates that alternative splicing in plants has a limited role in functional expansion of the proteome.BMC Genomics. 2009 Apr 9;10:154. doi: 10.1186/1471-2164-10-154. BMC Genomics. 2009. PMID: 19358722 Free PMC article.
-
Functional implications of structural predictions for alternative splice proteins expressed in Her2/neu-induced breast cancers.J Proteome Res. 2011 Dec 2;10(12):5503-11. doi: 10.1021/pr200772w. Epub 2011 Oct 28. J Proteome Res. 2011. PMID: 22003824 Free PMC article.
-
ProSAS: a database for analyzing alternative splicing in the context of protein structures.Nucleic Acids Res. 2008 Jan;36(Database issue):D63-8. doi: 10.1093/nar/gkm793. Epub 2007 Oct 11. Nucleic Acids Res. 2008. PMID: 17933774 Free PMC article.
References
-
- Black, D. L. (2003) Annu. Rev. Biochem. 72, 291–336. - PubMed
-
- Brett, D., Hanke, J., Lehmann, G., Haase, S., Delbruck, S., Krueger, S., Reich, J. & Bork, P. (2000) FEBS Lett. 474, 83–86. - PubMed
-
- Johnson, J. M., Castle, J., Garrett-Engele, P., Kan, Z., Loerch, P. M., Armour, C. D., Santos, R., Schadt, E. E., Stoughton, R. & Shoemaker, D. D. (2003) Science 302, 2141–2144. - PubMed
-
- Xu, X., Yang, D., Ding, J. H., Wang, W., Chu, P. H., Dalton, N. D., Wang, H. Y., Bermingham, J. R., Jr., Ye, Z., Liu, F., et al. (2005) Cell 120, 59–72. - PubMed
-
- Johnson, C. R. & Jarvis, W. D. (2004) Apoptosis 9, 423–427. - PubMed
Publication types
MeSH terms
Substances
LinkOut - more resources
Full Text Sources

