. 2005 Dec 5;171(5):799-810.
doi: 10.1083/jcb.200506083.

Nesprin-3, a novel outer nuclear membrane protein, associates with the cytoskeletal linker protein plectin

Affiliations

Nesprin-3, a novel outer nuclear membrane protein, associates with the cytoskeletal linker protein plectin

Kevin Wilhelmsen et al. J Cell Biol. .

Abstract

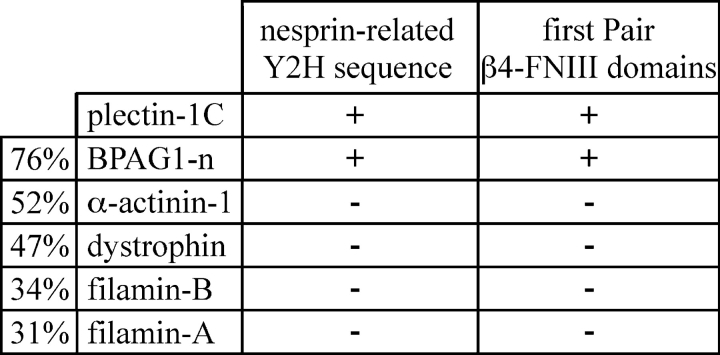
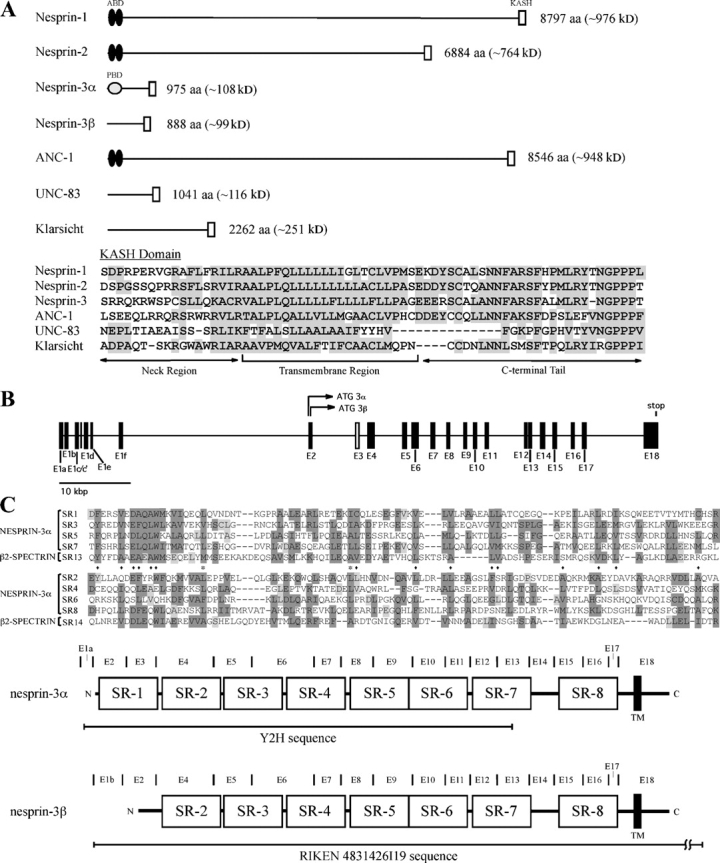
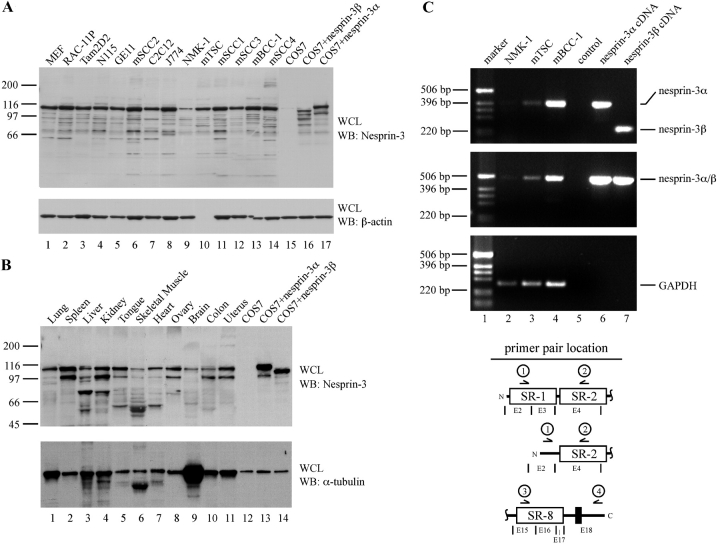
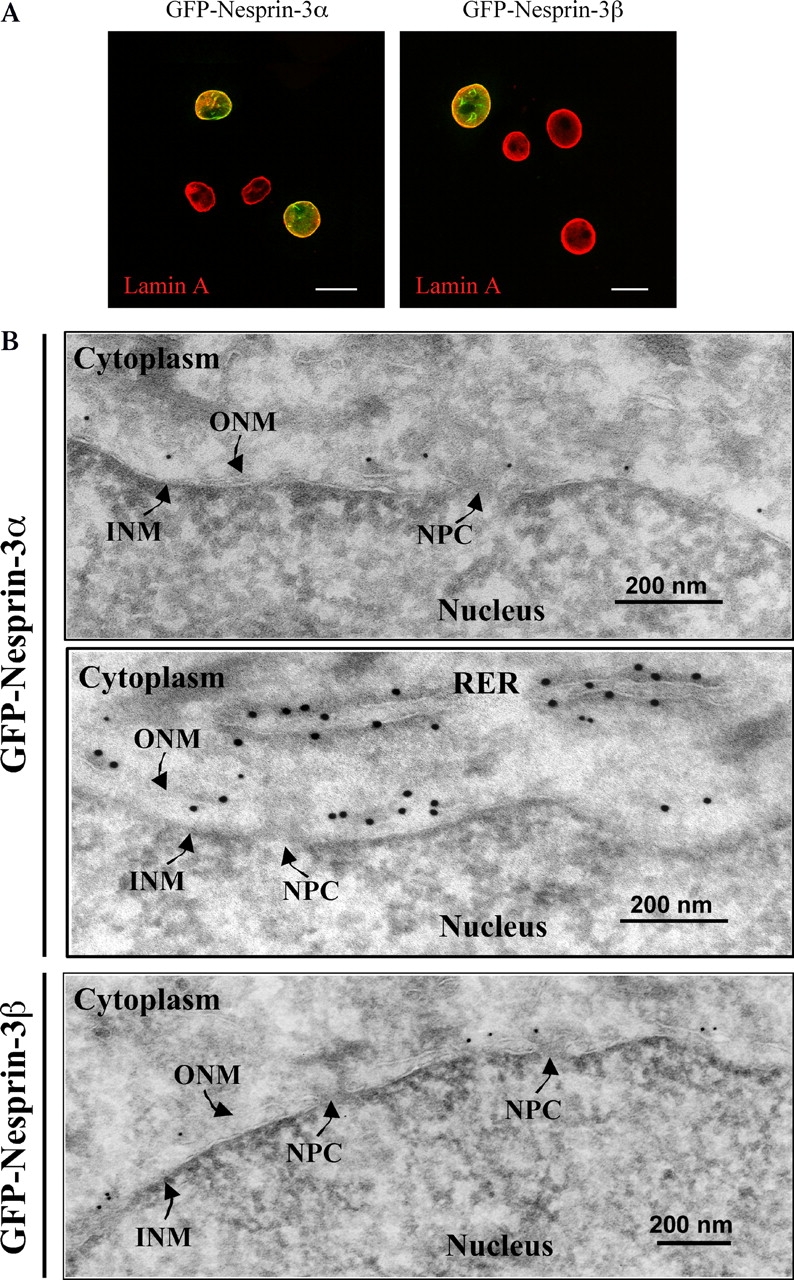
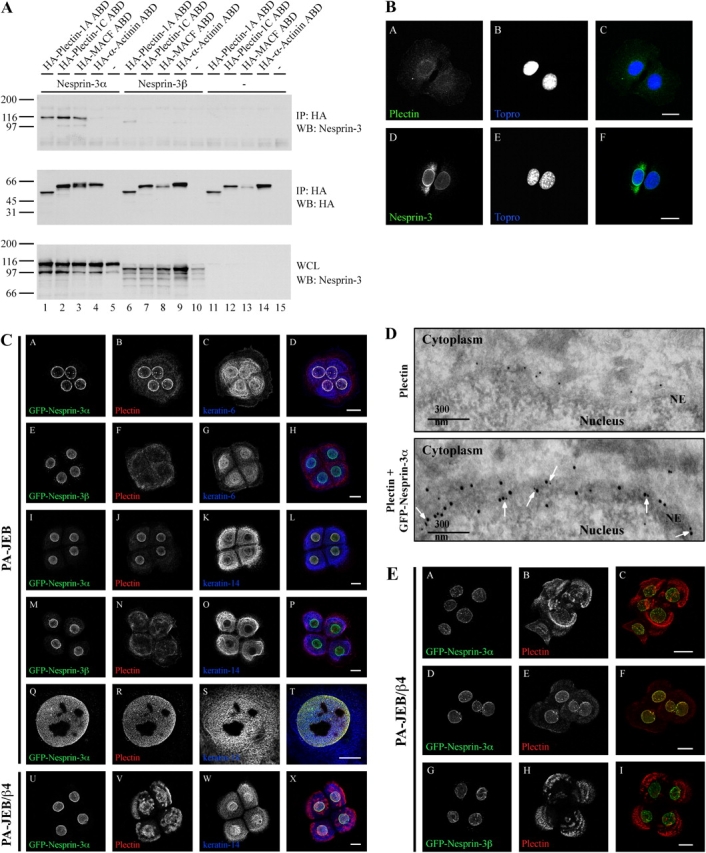
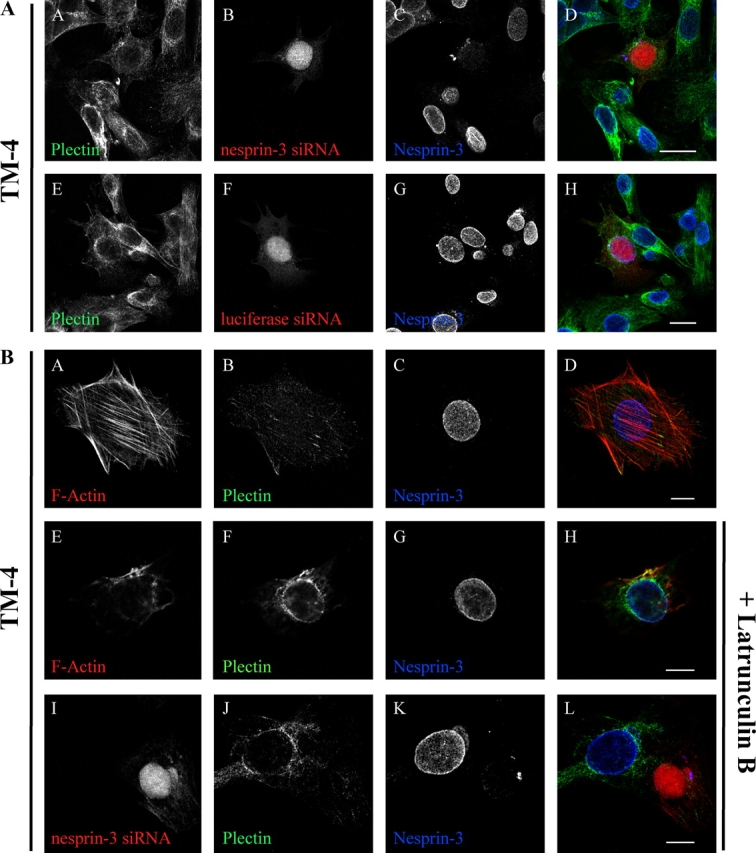
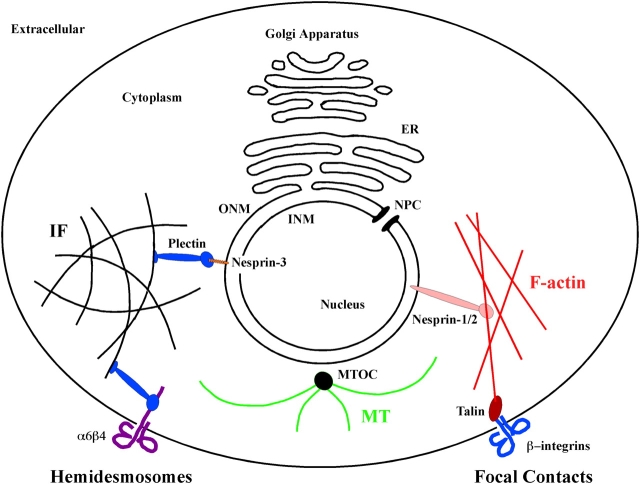
Despite their importance in cell biology, the mechanisms that maintain the nucleus in its proper position in the cell are not well understood. This is primarily the result of an incomplete knowledge of the proteins in the outer nuclear membrane (ONM) that are able to associate with the different cytoskeletal systems. Two related ONM proteins, nuclear envelope spectrin repeat (nesprin)-1 and -2, are known to make direct connections with the actin cytoskeleton through their NH2-terminal actin-binding domain (ABD). We have now isolated a third member of the nesprin family that lacks an ABD and instead binds to the plakin family member plectin, which can associate with the intermediate filament (IF) system. Overexpression of nesprin-3 results in a dramatic recruitment of plectin to the nuclear perimeter, which is where these two molecules are colocalized with both keratin-6 and -14. Importantly, plectin binds to the integrin alpha6beta4 at the cell surface and to nesprin-3 at the ONM in keratinocytes, suggesting that there is a continuous connection between the nucleus and the extracellular matrix through the IF cytoskeleton.


Figures

Figure 1.
Figure 1.
Y2H analysis of the interaction between either the nesprin-related Y2H sequence or the first pair of FNIII domains of β4 with several different ABDs. Interactions were scored + when the plating efficiencies on selective SC-LTHA plates were >30% of those on nonselective SC-LT plates at 5 d of growth. Interactions were scored − when no colonies were detected at 10 d of growth. The percent homology of the other ABDs to the plectin ABD is shown in the column on the left. The results for the interactions of the first pair of FNIII domains with the ABDs listed have been reported previously (Litjens et al., 2003).
Figure 2.
Figure 2.
Sequence analysis of nesprin-3. (A) Scaled diagrams of the nesprin-1, -2, -3α, and -3β, ANC-1, UNC-83, and D. melanogaster Klarsicht protein are presented. The sequence alignment of the KASH domain of the different murine nesprins, ANC-1 and UNC-83, with the conserved domain in the D. melanogaster Klarsicht protein is shown with similar amino acids shaded gray. (B) Organization of the nesprin-3 genome. The 18 exons are labeled as E1–E18 and are depicted as closed bars, except the exon unique to nesprin-3α (E3), which is depicted as an open box. The translation start sites for nesprin-3α and -3β are shown in E2. The distances are drawn to scale with the measurement bar. (C) SRs 1, 3, 5, and 7, and 2, 4, 6, and 8 of nesprin-3α are shown aligned with the 13th and 14th SRs of spectrin-β2, respectively. Dark gray boxes depict alignment of more than three similar amino acids in an alignment set. Light gray boxes depict similar amino acids to a majority of those in the opposing alignment set. A diamond indicates that residues are conserved in only one alignment set, and an asterisk indicates residues that are conserved in both sets. Below the SR alignment the structures of nesprin-3α and -3β are shown. The location of the exons are denoted by bars and labeled in between each accordingly as E1–E18. The region of nesprin-3α encoded by the cDNA found in the Y2H screen is underlined, as is the sequence for nesprin-3β (RIKEN clone 4831426I19) found in the database. The SRs are depicted as open boxes. In exon 18, the RIKEN sequence continues for another 2,198 nucleotides after the stop codon. The NH2 terminus is to the left and the COOH terminus is to the right. The distances are drawn to scale.
Figure 3.
Figure 3.
Tissue and cell line distribution of nesprin-3. (A) The indicated mouse-derived cell lines were lysed with RIPA buffer to extract NE components. Whole cell lysates (WCLs) of untransfected, nesprin-3α cDNA–transfected, or nesprin-3β cDNA–transfected COS7 cells were included as controls. WCL samples were loaded and run in a 4–20% SDS-PAGE gel, transferred to PVDF membrane, and probed for the presence of nesprin-3 using the GST-nesprin-3-SR7–derived antibodies. A protein blot for β-actin was used as a loading control. (B) The indicated mouse tissues were dounce homogenized in RIPA buffer. WCLs of these samples were analyzed as in B. A protein blot for α-tubulin was used as a loading control. (C) To determine the selectivity of nesprin-3α and -3β expression, the mouse cell lines NMK-1, mTSC, and mBCC-1 were used. Primers annealing on either side of the nesprin-3α–specific exon 3 (primers 1 and 2) were used to determine the presence of either variant in these cell lines (top; see Results). Primers that would amplify exons 15–18 of nesprin-3 (primers 3 and 4) were used as a control for mRNA fidelity and specificity (middle). Nesprin-3α and -3β cDNAs were used as controls in these PCR reactions. A PCR of GAPDH was also included as a control for nesprin-3 expression levels and mRNA fidelity (bottom). Schematic representations (Fig. 2 C) of the regions of nesprin-3α and -3β amplified by primer pairs are shown underneath the image. Only part of nesprin-3 is depicted, for simplicity.
Figure 4.
Figure 4.
Subcellular localization of nesprin-3α and -3β. (A) To determine the subcellular location of nesprin-3, PA-JEB keratinocytes were transiently transfected with either GFP-nesprin-3α or -3β cDNA, and the expression pattern was analyzed by fluorescence microscopy. Immunofluorescence studies of endogenous lamin A were performed using mAb 133A2. Bar, 20 μM. Four cells are shown in each image. (B) To determine which lipid bilayer of the NE contains nesprin-3, ultrathin sections of PA-JEB cells stably expressing either nesprin-3α (top and middle) or -3β (bottom) were labeled with rabbit pAbs against GFP, followed by incubation with 15-nm gold-conjugated protein A. NPC, nuclear pore complex.
Figure 5.
Figure 5.
Nesprin-3α associates with plectin in cells. (A) COS7 cells were transiently transfected with either the nesprin-3α (lanes 1–5) or -3β (lanes 6–10) cDNA constructs, or a control plasmid (lanes 10–15) and expression constructs for the HA-plectin-1A ABD (lanes 1, 6, and 11), HA-plectin-1C ABD (lanes 2, 7, and 12), HA-MACF ABD (lanes 3, 8, and 13), HA-α-actinin-1 ABD (lanes 4, 9, and 14), or a control plasmid (lanes 5, 10, and 15). The cells were lysed in RIPA buffer and HA-IPs were probed for the presence of nesprin-3 (top) and the HA-tagged ABDs (middle). WCLs were probed for expression levels of the two different nesprin-3 isoforms (bottom). (B) MEF cells were stained for endogenous plectin using the mAb 121 (A) and nesprin-3 using rabbit pAbs (D). The location of the nucleus was visualized using Topro staining (B and E). C is a composite of A and B, and F is a composite of D and E. Bar, 20 μM. (C) PA-JEB (A–T) or PA-JEB/β4 (U–X) were stably transduced with retroviral constructs expressing either GFP-nesprin-3α (A–D, I–L, and Q–X) or GFP-nesprin-3β (E–H and M–P). Fluorescence studies were done to locate the GFP moiety (A, E, I, M, Q, and U), along with immunofluorescence studies of endogenous plectin (B, F, J, N, R, and V) and keratin-6 (C and G) or keratin-14 (K, O, S, and W). The far right image of each row depicts the composite image of the first three images in each row (D, H, L, P, T, and X). Four cells are shown in each image except for images Q–T, which show a higher magnification of the nucleus. All images are maximum projections. Bars: (A–P and U–X) 20 μM; (Q–T) 10 μM. (D) To determine the subcellular localization of nesprin-3 and plectin at the NE, ultrathin sections of PA-JEB cells stably expressing nesprin-3α were labeled with rabbit pAbs against the plectin-ABD (D16), followed by incubation with 10-nm gold-conjugated protein A. The sections were then fixed in 1% glutaraldehyde and reprobed with rabbit pAbs against GFP, followed by incubation with 15-nm gold-conjugated protein A. Arrows indicate areas where plectin and GFP-nesprin-3α are colocalized at the ONM (bottom). Control labeling was done in the same way, except that after plectin labeling and fixation in glutaraldehyde, the sections were reprobed with 15-nm gold-conjugated protein A only (top). Note that no labeling with 15-nm gold was seen at the NE. (E) PA-JEB/β4 cells stably expressing either GFP-nesprin-3α (A–F) or GFP-nesprin-3β (G–I) were visualized for GFP (A, D, and G) and plectin (B, E, and H). The far right image of each row depicts the composite image of the first two images in each row (C, F, and I). All images are maximum projections. Bar, 20 μM.
Figure 6.
Figure 6.
Endogenous nesprin-3 and plectin associate in TM-4 cells. (A) The mouse Sertoli cell line TM-4 was transiently transfected with either the pSUPER vector expressing the nesprin-3 siRNA (A–D) or the luciferase siRNA (E–H), along with an expression vector for mRFP at a 5:1 ratio. After 72 h, the cells were fixed and stained for endogenous plectin (A and E) and nesprin-3 using our pAbs (C and G). mRFP was visualized to determine which cells express the siRNAs (B and F). D and H are composite images of the first three images in each row. All images are maximum projections. Bar, 20 μM. (B) TM-4 cells were left untransfected (A–H) or transiently transfected with the pSUPER vector expressing the nesprin-3 siRNA, along with an expression vector for mRFP in a 5:1 ratio (I–L). After 72 h and just before fixation, the cells in images E–L were treated for 30 min with 0.2 μM latrunculin B. The cells were then fixed and stained for plectin (B, F, and J), nesprin-3 (C, G, and K), and F-actin (A and E). mRFP was visualized to determine which cells express the nesprin-3 siRNA (I). D, H, and L are composite images of the first three images in each row. Bar, 10 μM.
Figure 7.
Figure 7.
Model depicting how the nesprins can link the nucleus to the actin and IF cytoskeletal systems. Nesprin-3 at the ONM and the integrin β4 subunit at the cell surface are shown bound to the NH2-terminal plectin ABD. COOH-terminal plectin plakin repeats are free to make associations with IFs, thus linking the nucleus to the hemidesmosomes at the cell surface. In an analogous way, nesprin-1/2 and talin, bound to the cytoplasmic tail of β integrins, interact with the actin filaments, which link the nucleus to FCs (black, IF cytoskeleton; green, MT system; red, F-actin). MTOC, MT organizing center.

Similar articles

Cited by

References

    1. Apel, E.D., R.M. Lewis, R.M. Grady, and J.R. Sanes. 2000. Syne-1, a dystrophin- and Klarsicht-related protein associated with synaptic nuclei at the neuromuscular junction. J. Biol. Chem. 275:31986–31995. - PubMed
    1. Borradori, L., and A. Sonnenberg. 1999. Structure and function of hemidesmosomes: more than simple adhesion complexes. J. Invest. Dermatol. 112:411–418. - PubMed
    1. Brummelkamp, T.R., R. Bernards, and R. Agami. 2002. A system for stable expression of short interfering RNAs in mammalian cells. Science. 296:550–553. - PubMed
    1. Burke, B., and C.L. Stewart. 2002. Life at the edge: the nuclear envelope and human disease. Nat. Rev. Mol. Cell Biol. 3:575–585. - PubMed
    1. de Pereda, J.M., G. Wiche, and R.C. Liddington. 1999. Crystal structure of a tandem pair of fibronectin type III domains from the cytoplasmic tail of integrin alpha6beta4. EMBO J. 18:4087–4095. - PMC - PubMed

Publication types