Weak force stalls protrusion at the leading edge of the lamellipodium
- PMID: 16326894
- PMCID: PMC1367330
- DOI: 10.1529/biophysj.105.064600
Weak force stalls protrusion at the leading edge of the lamellipodium
Abstract
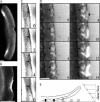
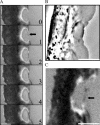
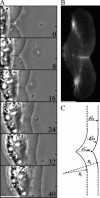
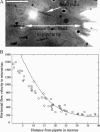
Protrusion, the first step of cell migration, is driven by actin polymerization coupled to adhesion at the cell's leading edge. Polymerization and adhesive forces have been estimated, but the net protrusion force has not been measured accurately. We arrest the leading edge of a moving fish keratocyte with a hydrodynamic load generated by a fluid flow from a micropipette. The flow arrests protrusion locally as the cell approaches the pipette, causing an arc-shaped indentation and upward folding of the leading edge. The effect of the flow is reversible upon pipette removal and dependent on the flow direction, suggesting that it is a direct effect of the external force rather than a regulated cellular response. Modeling of the fluid flow gives a surprisingly low value for the arresting force of just a few piconewtons per micrometer. Enhanced phase contrast, fluorescence, and interference reflection microscopy suggest that the flow does not abolish actin polymerization and does not disrupt the adhesions formed before the arrest but rather interferes with weak nascent adhesions at the very front of the cell. We conclude that a weak external force is sufficient to reorient the growing actin network at the leading edge and to stall the protrusion.
Figures


Similar articles
-
Direct measurement of the lamellipodial protrusive force in a migrating cell.J Cell Biol. 2006 Sep 11;174(6):767-72. doi: 10.1083/jcb.200601159. J Cell Biol. 2006. PMID: 16966418 Free PMC article.
-
The stochastic dynamics of filopodial growth.Biophys J. 2008 May 15;94(10):3839-52. doi: 10.1529/biophysj.107.123778. Epub 2008 Jan 30. Biophys J. 2008. PMID: 18234810 Free PMC article.
-
Membrane tension controls adhesion positioning at the leading edge of cells.J Cell Biol. 2017 Sep 4;216(9):2959-2977. doi: 10.1083/jcb.201611117. Epub 2017 Jul 7. J Cell Biol. 2017. PMID: 28687667 Free PMC article.
-
The comings and goings of actin: coupling protrusion and retraction in cell motility.Curr Opin Cell Biol. 2005 Oct;17(5):517-23. doi: 10.1016/j.ceb.2005.08.004. Curr Opin Cell Biol. 2005. PMID: 16099152 Review.
-
Life at the leading edge.Cell. 2011 Jun 24;145(7):1012-22. doi: 10.1016/j.cell.2011.06.010. Cell. 2011. PMID: 21703446 Review.
Cited by
-
Leukocyte transmigration and longitudinal forward-thrusting force in a microfluidic Transwell device.Biophys J. 2021 Jun 1;120(11):2205-2221. doi: 10.1016/j.bpj.2021.03.037. Epub 2021 Apr 8. Biophys J. 2021. PMID: 33838136 Free PMC article.
-
Actin filament elasticity and retrograde flow shape the force-velocity relation of motile cells.Biophys J. 2012 Jan 18;102(2):287-95. doi: 10.1016/j.bpj.2011.12.023. Biophys J. 2012. PMID: 22339865 Free PMC article.
-
Growth factor regulation of corneal keratocyte differentiation and migration in compressed collagen matrices.Invest Ophthalmol Vis Sci. 2010 Feb;51(2):864-75. doi: 10.1167/iovs.09-4200. Epub 2009 Oct 8. Invest Ophthalmol Vis Sci. 2010. PMID: 19815729 Free PMC article.
-
Decomposition of cell activities revealing the role of the cell cycle in driving biofunctional heterogeneity.Sci Rep. 2021 Dec 6;11(1):23431. doi: 10.1038/s41598-021-02926-4. Sci Rep. 2021. PMID: 34873244 Free PMC article.
-
Direct measurement of the lamellipodial protrusive force in a migrating cell.J Cell Biol. 2006 Sep 11;174(6):767-72. doi: 10.1083/jcb.200601159. J Cell Biol. 2006. PMID: 16966418 Free PMC article.
References
-
- Abercrombie, M. 1980. The crawling movement of metazoan cells. Proc. R. Soc. Lond. B Biol. Sci. 207:129–147.
-
- Pollard, T. D., and G. G. Borisy. 2003. Cellular motility driven by assembly and disassembly of actin filaments. Cell. 112:453–465. - PubMed
-
- Grebecki, A. 1994. Membrane and cytoskeleton flow in motile cells with emphasis on the contribution of free-living amoebae. Int. Rev. Cytol. 148:37–80.
-
- Mogilner, A., and G. Oster. 2003. Polymer motors: pushing out the front and pulling up the back. Curr. Biol. 13:R721–R733. - PubMed
Publication types
MeSH terms
Substances
Grants and funding
LinkOut - more resources
Full Text Sources

