. 2005 Nov 28;33(21):e183.
doi: 10.1093/nar/gni177.

Allele quantification using molecular inversion probes (MIP)

Affiliations

Allele quantification using molecular inversion probes (MIP)

Yuker Wang et al. Nucleic Acids Res. .

Abstract

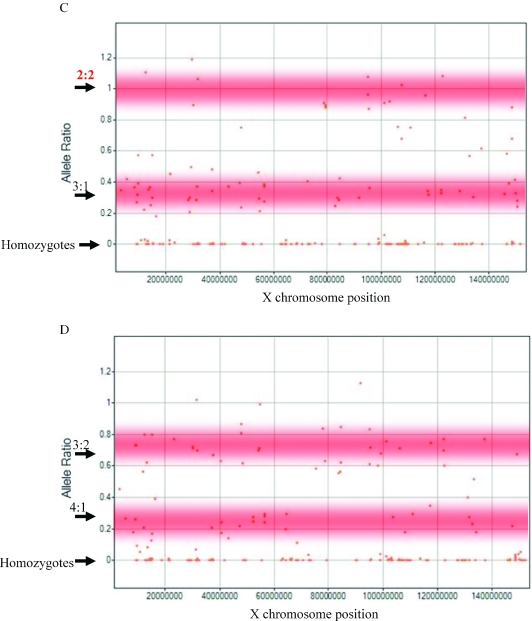
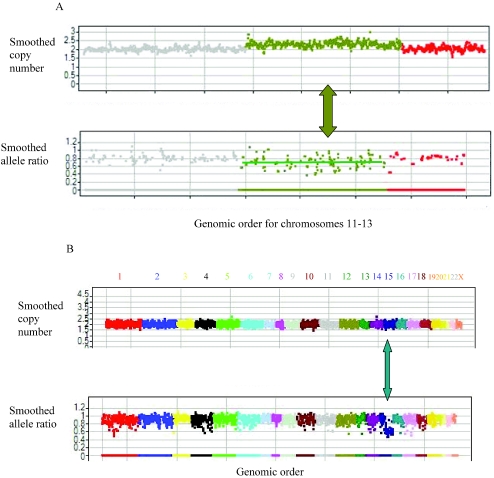
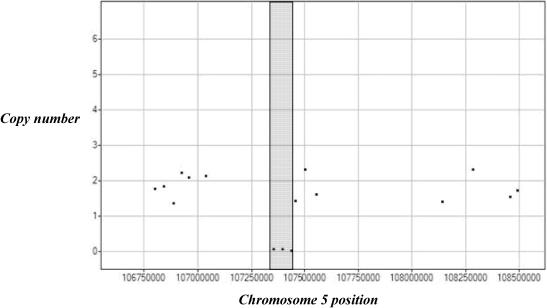
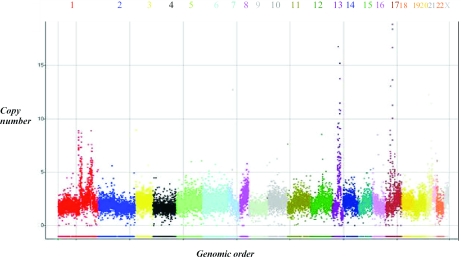
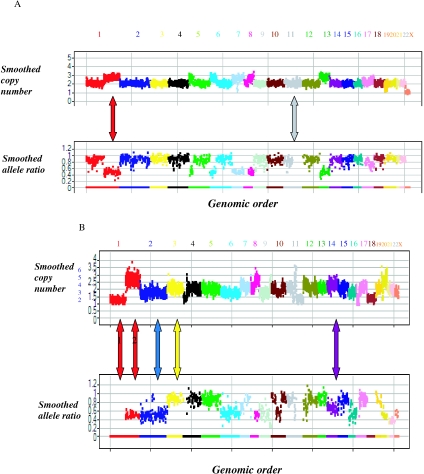
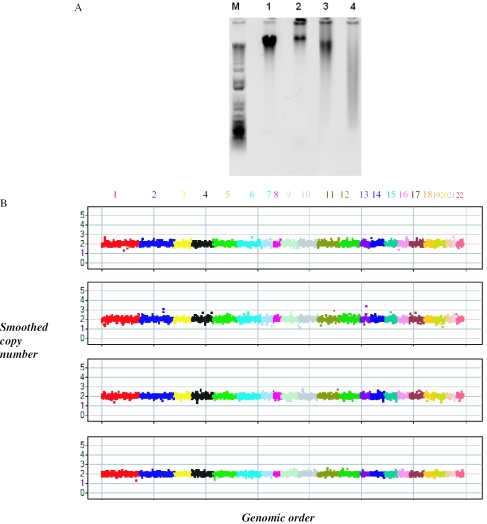
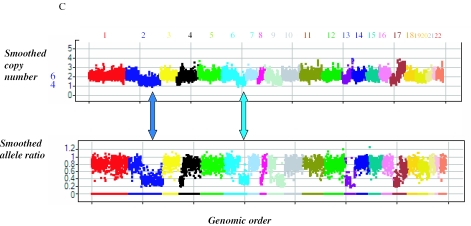
Detection of genomic copy number changes has been an important research area, especially in cancer. Several high-throughput technologies have been developed to detect these changes. Features that are important for the utility of technologies assessing copy number changes include the ability to interrogate regions of interest at the desired density as well as the ability to differentiate the two homologs. In addition, assessing formaldehyde fixed and paraffin embedded (FFPE) samples allows the utilization of the vast majority of cancer samples. To address these points we demonstrate the use of molecular inversion probe (MIP) technology to the study of copy number. MIP is a high-throughput genotyping technology capable of interrogating >20 000 single nucleotide polymorphisms in the same tube. We have shown the ability of MIP at this multiplex level to provide copy number measurements while obtaining the allele information. In addition we have demonstrated a proof of principle for copy number analysis in FFPE samples.


Figures

Figure 1
Figure 1
Relationship between copy sum RSD and signal strength. For each marker copy sum RSD and the average signal strength are calculated using the reference samples as described in the Methods section. The best performing markers are those with the lowest copy sum RSD. As expected, markers with low signal are more probable to have higher copy sum RSD.
Figure 2
Figure 2
The trade-off between false positive and false negatives rates. The false negative rate was computed using X chromosome markers in the males, and the false positive rate was calculated using all the autosomes in the total reference sample set. The effect of selecting different sets of markers based on copy sum RSD is shown. The best markers (10 101 probes) are plotted in blue, all markers unfiltered are plotted in yellow (18 180 probes) and an intermediate cut is shown in pink (14 342 probes).
Figure 3
Figure 3
Example results from a male sample. A genomic copy number view of a male sample. Each chromosome is labeled and coded with a unique color. In both panels the X-axis shows the best 10 101 markers in the genomic order. The Y-axis shows the copy number (upper panel) and smoothed copy number using a moving window of seven markers (lower panel). The copy number of markers on the autosomes fluctuates around 2, distinctly different from markers on the X chromosome (the last chromosome marked with an arrow). As expected the fluctuation is greatly reduced with the smoothing done by surrounding markers.
Figure 4
Figure 4
Allele ratio in polysomy X cell lines. (A) A whole genome view of the allele ratio in NA04626 cell line with 3X chromosomes. Each chromosome is labeled and coded with a unique color. The X-axis shows the 10 101 markers in the genomic order. The Y-axis shows the smoothed allele ratio. Points that are closest to the homozygous cluster are assigned an allele ratio of 0 and those near the heterozygous cluster are smoothed using data from the non-homozygous markers within the 7 marker moving window. Normal heterozygous calls are expected to have an allele ratio of 1, but our measurements generate a lower allele ratio for reasons explained in the method section. As expected for this cell line carrying three times the allele ratio for the X chromosome is 0.5 (arrow pointing to 1:2 ratio of 0.5) and for the autosomes is close to 1. (B) The false negative rate was computed using X chromosome markers in the cell line containing 3X chromosomes, and the false positive rate was calculated using all the autosomes in this sample and the reference set. The effect of selecting different sets of markers based on copy sum RSD is shown. The best markers (10 101 probes) are plotted in blue, all markers unfiltered are plotted in yellow (18 180 probes) and an intermediate cut is shown in pink (14 342 probes). (C) Allele ratio in the X chromosome of NA01416 cell line containing 4X chromosomes. The X-axis shows chromosome X position and the Y-axis depicts the allele ratio. Markers with an allele ratio around 0 are homozygous. In addition a number of markers have an allele ratio close to 1, and others have an allele ratio of 0.33. The shaded zones depict the regions with the expected allele ratio. (D) Allele ratio in the X chromosome of GM6061 cell line containing 5X chromosomes. The X-axis shows chromosome X position and the Y-axis depicts the allele ratio. Markers with an allele ratio around 0 are homozygous. In addition a number of markers have an allele ratio close to 0.67, and others have an allele ratio around 0.25. The shaded zones depict the regions with the expected allele ratio.
Figure 4
Figure 4
Allele ratio in polysomy X cell lines. (A) A whole genome view of the allele ratio in NA04626 cell line with 3X chromosomes. Each chromosome is labeled and coded with a unique color. The X-axis shows the 10 101 markers in the genomic order. The Y-axis shows the smoothed allele ratio. Points that are closest to the homozygous cluster are assigned an allele ratio of 0 and those near the heterozygous cluster are smoothed using data from the non-homozygous markers within the 7 marker moving window. Normal heterozygous calls are expected to have an allele ratio of 1, but our measurements generate a lower allele ratio for reasons explained in the method section. As expected for this cell line carrying three times the allele ratio for the X chromosome is 0.5 (arrow pointing to 1:2 ratio of 0.5) and for the autosomes is close to 1. (B) The false negative rate was computed using X chromosome markers in the cell line containing 3X chromosomes, and the false positive rate was calculated using all the autosomes in this sample and the reference set. The effect of selecting different sets of markers based on copy sum RSD is shown. The best markers (10 101 probes) are plotted in blue, all markers unfiltered are plotted in yellow (18 180 probes) and an intermediate cut is shown in pink (14 342 probes). (C) Allele ratio in the X chromosome of NA01416 cell line containing 4X chromosomes. The X-axis shows chromosome X position and the Y-axis depicts the allele ratio. Markers with an allele ratio around 0 are homozygous. In addition a number of markers have an allele ratio close to 1, and others have an allele ratio of 0.33. The shaded zones depict the regions with the expected allele ratio. (D) Allele ratio in the X chromosome of GM6061 cell line containing 5X chromosomes. The X-axis shows chromosome X position and the Y-axis depicts the allele ratio. Markers with an allele ratio around 0 are homozygous. In addition a number of markers have an allele ratio close to 0.67, and others have an allele ratio around 0.25. The shaded zones depict the regions with the expected allele ratio.
Figure 5
Figure 5
Mosaic aberrations in reference samples. (A) A genomic copy number and allele ratio view of the reference sample NA19193 carrying a mosaic duplication of chromosome 12. Each chromosome is labeled and coded with a unique color. In both panels the X-axis shows the genomic order of the chromosomes 11–13 markers that belong to the best 10 101 marker set. The Y-axis uses a moving window of seven markers to show the smoothed copy number (upper panel) and smoothed allele ratio (lower panel). Markers on chromosome 12 have on average a higher copy number and a lower allele ratio than the surrounding chromosomes. This is consistent with a ‘mosaic’ duplication of chromosome 12 in a fraction of the cells. (B) A genomic copy number and allele ratio view of the reference sample NA18573 containing a mosaic LOH in chromosome 15. Each chromosome is labeled and coded with a unique color. In both panels the X-axis shows the markers in the genomic order for all chromosomes. The Y-axis uses a moving window of seven markers to show the smoothed copy number (upper panel) and smoothed allele ratio (lower panel). The region in chromosome 15 denoted by an arrow have the normal copy number of 2 (upper panel) but an allele ratio of 0.6 (lower panel). This is consistent with an event (e.g. mitotic recombination) leading some of the cells to have LOH with no change in copy number.
Figure 6
Figure 6
Detection of a homozygous deletion. The X-axis shows the chromosomal position in a region of chromosome 5, and the Y-axis shows the copy number in the cell line HCC1395. Three markers (in grey box) showing minimal signal indicate the presence of a homozygous deletion. On one side, the deletion breakpoint is mapped to a 20 kb segment.
Figure 7
Figure 7
Detection of amplifications. This is a genomic copy number view of the cancer cell line UACC812. Each chromosome is labeled and coded with a unique color. The use of the full set of 18 180 markers with valid genotyping data showed the amplification sites with more clarity. The X-axis shows the 18 180 markers in their genomic order, and the Y-axis shows the copy number. Several amplifications are seen with the most dramatic on chromosomes 13 and 17.
Figure 8
Figure 8
Integrated copy number and allele ratio in cancer cell lines. (A) This is a genomic copy number and allele ratio view of A2058 cell line. Each chromosome is labeled and coded with a unique color. The X-axis shows the best 10 101 markers in their genomic order, and the Y-axis shows the smoothed copy number (upper panel) and smoothed allele ratio (lower panel). The gray arrow points to a section of chromosome 11 that has undergone LOH (allele ratio of 0) with no copy number change (copy number of 2). The red arrow points to a section of chromosome 1 with an allele ratio of 0.5, consistent with the presence of three copies. Integrated copy number and allele ratio information are consistent with the presence of three copies of sections of chromosomes 5, 6, 7, 8 and 13. (B) This is a genomic copy number and allele ratio view of MDA-MB-175-VII cell line. Each chromosome is labeled and coded with a unique color and its number is noted above. The X-axis shows the markers in the genomic order, and the Y-axis shows the smoothed copy number (upper panel) and smoothed allele ratio (lower panel). The Y-axis shows the copy number automatically generated value assuming a modal chromosome copy number of 2 (black) or by interpretation of copy number and allele ratio (blue). When the modal number of chromosomes in a cell is not 2, interpretation of both copy number and allele ratio is necessary is helpful in determining the absolute number of chromosomal copies. This is an example of such interpretation of this combined data. There are several chromosomal regions with an allele ratio of 0.5 indicating the presence of three or the multiple of three chromosomes. Specifically both the red arrow labeled 2 pointing to a section in chromosome 1 and the blue arrow pointing to chromosome 2 have allele ratio of 0.5. However the corresponding copy numbers are quite different between the two chromosomes. We conclude that the copy number for the section on chromosome 1 and chromosome 2 are six and three copies, respectively. Similarly, chromosomes 6, 9 and the distal part of chromosome 8 have allele ratio of 0.5. Given the copy number differences we conclude that the former two have three copies, while the latter has six copies. Chromosome 3 (yellow) has an allele ratio of ∼1 and a slightly higher copy number than chromosome 2. This is consistent with four chromosome 2 copies—two for each of the two homologs. The same is true for other chromosomes, e.g. chromosomes 6 and 13. Chromosome 14 has a slightly higher copy number than chromosome 13 and has an allele ratio 0.6–0.7. This is consistent with five copies of chromosome 14—three copies of one homolog and two copies of the other. Finally there are regions of LOH as manifested by the proximal segment of chromosome 1. The copy number of this segment is almost half that determined for chromosome 3, and is therefore consistent with carrying two copies of one homolog and zero for the other. With this integrated information about copy number and allele ratio we conclude this cell line has large chromosomal segments with copy number ranging from two to six copies. The blue numbers next to the copy number axis values are those resulting from the above interpretation of the combined copy number and allele ratio views. These conclusions are consistent with previous FISH data that characterized this cell line as having 84 chromosomes and most chromosomes present in three or four copies (25) ().
Figure 9
Figure 9
Analysis of FFPE samples. (A) We show an agarose gel picture of DNA purified from a standard blood control sample and three FFPE samples for normal brain, colon and liver. The integrity of DNA in the three samples varies. (B) A genomic copy number view of the three normal FFPE samples shown in (A) and NA12156, a normal cell line control sample. Each of the autosomes is labeled and shown with a unique color. The X-axis shows the markers in the genomic order. The Y-axis shows the smoothed copy number using a moving window of seven markers. The panels from top to bottom show results of the normal NA12156 and the three FFPE samples from normal brain, colon and liver. The performance of all three FFPE samples is quite similar to the normal control cell line. (C) A genomic copy number view of a FFPE liver tumor sample. Each of the autosomes is labeled and shown with a unique color. In both panels the X-axis shows the markers in the genomic order. The Y-axis shows the smoothed copy number using a moving window of seven markers (upper panel) and smoothed allele ratio using a moving window of seven markers (lower panel). The blue arrow points to a region of chromosome 2 with an allele ratio of 0.35, consistent with 3:1 ratio between the two alleles indicating the presence of four copies. There are other genomic segments like regions of chromosome 6 (denoted by bright blue/green arrow) that have the same allele ratio and are probable to have four copies of the chromosomes. Most other chromosomes have an allele ratio close to 1 indicating an even number of chromosomes. The copy number of these chromosomes must be higher than 4 as is evident from the copy number data, and it is most probably 6 given the measured difference in copy number with those regions with four copies. The blue numbers next to the copy number axis values are based on the interpretation of both the copy number and allele ratio views.
Figure 9
Figure 9
Analysis of FFPE samples. (A) We show an agarose gel picture of DNA purified from a standard blood control sample and three FFPE samples for normal brain, colon and liver. The integrity of DNA in the three samples varies. (B) A genomic copy number view of the three normal FFPE samples shown in (A) and NA12156, a normal cell line control sample. Each of the autosomes is labeled and shown with a unique color. The X-axis shows the markers in the genomic order. The Y-axis shows the smoothed copy number using a moving window of seven markers. The panels from top to bottom show results of the normal NA12156 and the three FFPE samples from normal brain, colon and liver. The performance of all three FFPE samples is quite similar to the normal control cell line. (C) A genomic copy number view of a FFPE liver tumor sample. Each of the autosomes is labeled and shown with a unique color. In both panels the X-axis shows the markers in the genomic order. The Y-axis shows the smoothed copy number using a moving window of seven markers (upper panel) and smoothed allele ratio using a moving window of seven markers (lower panel). The blue arrow points to a region of chromosome 2 with an allele ratio of 0.35, consistent with 3:1 ratio between the two alleles indicating the presence of four copies. There are other genomic segments like regions of chromosome 6 (denoted by bright blue/green arrow) that have the same allele ratio and are probable to have four copies of the chromosomes. Most other chromosomes have an allele ratio close to 1 indicating an even number of chromosomes. The copy number of these chromosomes must be higher than 4 as is evident from the copy number data, and it is most probably 6 given the measured difference in copy number with those regions with four copies. The blue numbers next to the copy number axis values are based on the interpretation of both the copy number and allele ratio views.

Similar articles

Cited by

References

    1. Pui C.H., Relling M.V., Downing J.R. Acute lymphoblastic leukemia. N. Engl. J. Med. 2004;350:1535–1548. - PubMed
    1. Slamon D.J., Leyland-Jones B., Shak S., Fuchs H., Paton V., Bajamonde A., Fleming T., Eiermann W., Wolter J., Pegram M., et al. Use of chemotherapy plus a monoclonal antibody against HER2 for metastatic breast cancer that overexpresses HER2. N. Engl. J. Med. 2001;344:783–792. - PubMed
    1. Kallioniemi O.P., Kallioniemi A., Sudar D., Rutovitz D., Gray J.W., Waldman F., Pinkel D. Comparative genomic hybridization: a rapid new method for detecting and mapping DNA amplification in tumors. Semin. Cancer Biol. 1993;4:41–46. - PubMed
    1. Pinkel D., Segraves R., Sudar D., Clark S., Poole I., Kowbel D., Collins C., Kuo W.L., Chen C., Zhai Y., et al. High resolution analysis of DNA copy number variation using comparative genomic hybridization to microarrays. Nature Genet. 1998;20:207–211. - PubMed
    1. Pollack J.R., Perou C.M., Alizadeh A.A., Eisen M.B., Pergamenschikov A., Williams C.F., Jeffrey S.S., Botstein D., Brown P.O. Genome-wide analysis of DNA copy-number changes using cDNA microarrays. Nature Genet. 1999;23:41–46. - PubMed

Publication types