. 2005 Dec;25(23):10639-51.
doi: 10.1128/MCB.25.23.10639-10651.2005.

Assembly and disassembly of nucleosome core particles containing histone variants by human nucleosome assembly protein I

Affiliations

Assembly and disassembly of nucleosome core particles containing histone variants by human nucleosome assembly protein I

Mitsuru Okuwaki et al. Mol Cell Biol. 2005 Dec.

Abstract

Histone variants play important roles in the maintenance and regulation of the chromatin structure. In order to characterize the biochemical properties of the chromatin structure containing histone variants, we investigated the dynamic status of nucleosome core particles (NCPs) that were assembled with recombinant histones. We found that in the presence of nucleosome assembly protein I (NAP-I), a histone chaperone, H2A-Barr body deficient (H2A.Bbd) confers the most flexible nucleosome structure among the mammalian histone H2A variants known thus far. NAP-I mediated the efficient assembly and disassembly of the H2A.Bbd-H2B dimers from NCPs. This reaction was accomplished more efficiently when the NCPs contained H3.3, a histone H3 variant known to be localized in the active chromatin, than when the NCPs contained the canonical H3. These observations indicate that the histone variants H2A.Bbd and H3.3 are involved in the formation and maintenance of the active chromatin structure. We also observed that acidic histone binding proteins, TAF-I/SET and B23.1, demonstrated dimer assembly and disassembly activity, but the efficiency of their activity was considerably lower than that of NAP-I. Thus, both the acidic nature of NAP-I and its other functional structure(s) may be essential to mediate the assembly and disassembly of the dimers in NCPs.


Figures
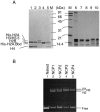
FIG. 1.
FIG. 1.
Purification of recombinant histones and assembly of the nucleosome core particles. A. Expression, purification, and refolding of recombinant histones. Refolded histone H3-H4, H3.3-H4, His-H2A-H2B, His-H2A.Bbd-H2B (lanes 1 to 4, respectively), histone octamers purified from HeLa cells (lanes 5 and 6), refolded histone octamers containing H2A, H2B, H3, and H4 (lane 7), H2A, H2B, H3.3, and H4 (lane 8), H2A.Bbd, H2B, H3, and H4 (lane 9), or H2A.Bbd, H2B, H3.3, and H4 (lane 10) were separated by 15% SDS-PAGE and visualized with CBB staining. Lanes M indicate the molecular weight markers. Positions of histones are indicated at the left side of the panels. B. Assembly of NCPs by the recombinant histone octamers. NCP1, NCP2, NCP3, and NCP4 were assembled with the recombinant histone octamers containing H2A/H2B/H3/H4, H2A/H2B/H3.3/H4, H2A.Bbd/H2B/H3/H4, or H2A.Bbd/H2B/H3.3/H4, respectively, on the 196-bp-5S rRNA gene fragment by the salt dilution method. Naked DNA (lane 1) and NCP1, NCP2, NCP3, and NCP4 (lanes 2 to 5, respectively) were separated on a 6% nucleoprotein gel in 0.5× Tris-borate-EDTA and visualized with EtBr staining. Positions of NCPs and free DNA are indicated to the right of the panel. N1 and N2 indicate two NCPs appeared in NCP1 and NCP2, whereas N3 indicates NCPs appeared in NCP3 and NCP4 (see Fig. 2C).
FIG. 2.
FIG. 2.
Characterization of the NCPs assembled with recombinant histone octamers. A. Nucleoprotein gel analysis of the NCPs. NCPs were assembled on the 5S rRNA gene fragment without (lane 1) or with histones H2A, H2B, H3, and H4 for NCP1 (lane 2) and H2A.Bbd, H2B, H3, and H4 for NCP3 (lane 3), loaded on a 6% polyacrylamide gel in 0.5× Tris-borate-EDTA, and visualized with autoradiography. The 5′ end of the sense strand relative to the transcription direction was labeled with 32P. Positions of the nucleosome (N1, N2, and N3) and the free DNA are indicated at the right side of the panel. B. DNase I footprinting of NCPs. Naked DNA and NCPs (NCP1 and NCP3) (lanes 1 to 3, respectively) were treated with increasing amounts of DNase I. DNA was purified, separated by electrophoresis on a 6% polyacrylamide gel containing 8 M urea in 1× Tris-borate-EDTA, and visualized with autoradiography. The 10-bp periodicity of DNase I-sensitive sites in the nucleosomal DNA is shown by bullets. DNA size markers are indicated at the left side of the panel. C. MNase digestion of NCPs and mapping of the nucleosome positioning. NPC1 and NCP3 (top and bottom panels, respectively; 200 ng DNA) were incubated with 0.1 unit of MNase at 37°C for 0, 2, 5, or 10 min (lanes 1 to 4, respectively). DNA was purified, separated on a 6% polyacrylamide gel in 0.5× Tris-borate-EDTA, and visualized with staining with EtBr (lanes 1 to 4). After MNase digestion, DNA was purified and digested with 1 unit of DraI at 37°C for 1 h. MNase- and DraI-digested DNA was purified, separated by 6% PAGE, and visualized with EtBr staining (lanes 5 to 8). Positions of DNA fragments generated by digestion of the full-length 5S rRNA gene with DraI and by digestion of the MNase-treated N1, N2, and N3 nucleosomal DNA with DraI were indicated by filled circles, filled triangles, filled squares, and blank triangles, respectively. Lane M indicates DNA size markers produced by digestion of the 196-bp 5S rRNA gene fragment with either DraI, ScaI, or MspI. Nucleosome positioning along the 5S rRNA gene fragment obtained from the MNase and restriction enzyme digestion assay is schematically summarized to the right of the panels.
FIG. 2.
FIG. 2.
Characterization of the NCPs assembled with recombinant histone octamers. A. Nucleoprotein gel analysis of the NCPs. NCPs were assembled on the 5S rRNA gene fragment without (lane 1) or with histones H2A, H2B, H3, and H4 for NCP1 (lane 2) and H2A.Bbd, H2B, H3, and H4 for NCP3 (lane 3), loaded on a 6% polyacrylamide gel in 0.5× Tris-borate-EDTA, and visualized with autoradiography. The 5′ end of the sense strand relative to the transcription direction was labeled with 32P. Positions of the nucleosome (N1, N2, and N3) and the free DNA are indicated at the right side of the panel. B. DNase I footprinting of NCPs. Naked DNA and NCPs (NCP1 and NCP3) (lanes 1 to 3, respectively) were treated with increasing amounts of DNase I. DNA was purified, separated by electrophoresis on a 6% polyacrylamide gel containing 8 M urea in 1× Tris-borate-EDTA, and visualized with autoradiography. The 10-bp periodicity of DNase I-sensitive sites in the nucleosomal DNA is shown by bullets. DNA size markers are indicated at the left side of the panel. C. MNase digestion of NCPs and mapping of the nucleosome positioning. NPC1 and NCP3 (top and bottom panels, respectively; 200 ng DNA) were incubated with 0.1 unit of MNase at 37°C for 0, 2, 5, or 10 min (lanes 1 to 4, respectively). DNA was purified, separated on a 6% polyacrylamide gel in 0.5× Tris-borate-EDTA, and visualized with staining with EtBr (lanes 1 to 4). After MNase digestion, DNA was purified and digested with 1 unit of DraI at 37°C for 1 h. MNase- and DraI-digested DNA was purified, separated by 6% PAGE, and visualized with EtBr staining (lanes 5 to 8). Positions of DNA fragments generated by digestion of the full-length 5S rRNA gene with DraI and by digestion of the MNase-treated N1, N2, and N3 nucleosomal DNA with DraI were indicated by filled circles, filled triangles, filled squares, and blank triangles, respectively. Lane M indicates DNA size markers produced by digestion of the 196-bp 5S rRNA gene fragment with either DraI, ScaI, or MspI. Nucleosome positioning along the 5S rRNA gene fragment obtained from the MNase and restriction enzyme digestion assay is schematically summarized to the right of the panels.
FIG. 3.
FIG. 3.
Disassembly of NCPs by acidic histone chaperones. A. Purified acidic histone chaperones. His-tagged recombinant acidic histone chaperones, TAF-I/SET, NAP-I, and B23.1 (lanes 1 to 3, respectively; 200 ng each) were separated by a 10% SDS-PAGE and visualized with CBB staining. Lane M indicates molecular weight markers. B. NAP-I specifically alters the structure of the NCPs containing H2A.Bbd. NCPs assembled with histone octamers as shown in Fig. 1 (100 ng, 0.8 pmol of DNA) were incubated at 30°C for 30 min without (lanes 1, 3, 6, 9, and 12) or with increasing amounts of histone chaperones (100 ng for lanes 4, 7, 10, and 13 and 500 ng for lanes 2, 5, 8, 11, and 14) followed by electrophoresis on a 6% polyacrylamide gel in 0.5× TBE. DNA was visualized with EtBr staining. TAF-I, NAP-I, and B23.1 were used as acidic histone chaperones for the top, middle, and bottom panels, respectively. TAF-I and NAP-I form dimers (28, 31), and B23.1 forms a pentamer (34) in solution, so that 500 ng of TAF-I, NAP-I, and B23.1 corresponds to 8, 6, and 3 pmol of oligomers, respectively. Positions of nucleosome and free DNA are indicated to the right of the panels.
FIG. 4.
FIG. 4.
NAP-I removes the histone H2A.Bbd-H2B dimers from the NCPs. A. NAP-I does not induce nucleosome sliding. NCP1 and NCP3 were assembled on the 5′-[32P]-labeled 5S rRNA gene fragment as shown in Fig. 2A. Naked DNA (lanes 1 and 2), NCP1 (lanes 3 and 4), and NCP3 (lanes 5 and 6) (100 ng, 0.8 pmol of DNA) were incubated in the absence (lanes 1, 3, and 5) or presence (lanes 2, 4, and 6) of excess amounts of NAP-I (500 ng, 6 pmol) followed by digestion with ExoIII. DNA was purified and analyzed by 6% PAGE with 8 M urea in 1× Tris-borate-EDTA. Positions of the major ExoIII posing sites that correspond to the nucleosome border are indicated by bullets. DNA size markers (lane M) and nucleosome positioning were shown at the right of the panel. B. Western blotting of the NCPs. NCP1 and NCP3 (100 ng, 0.8 pmol of DNA) were incubated at 30°C for 30 min without (lanes 1, 5, and 9) or with increasing amounts of NAP-I (100 ng [1.2 pmol] for lanes 2, 6, and 10, 200 ng [2.4 pmol] for lanes 3, 7, and 11, and 500 ng [6 pmol] for lanes 4, 8, and 12) followed by electrophoresis on a native 6% polyacrylamide gel. DNA was visualized with EtBr staining (lanes 1 to 4). DNA and proteins were transferred to a PVDF membrane, followed by Western blotting with anti-histone H3 and anti-histone H2A.Bbd antibodies (lanes 5 to 8 and 9 to 12, respectively). Positions of the NCPs (N1, N2, and N3), free DNA, and the free dimer-NAP-I complexes are indicated at the right side of the panel. C. NAP-I forms a complex with the H2A.Bbd-H2B dimers dissociated from the NCPs. Recombinant NAP-I (100 ng [1.2 pmol], 200 ng [2.4 pmol], and 500 ng [6 pmol]) for lanes 1 to 4, 5 to 8, and 9 to 12, respectively) were incubated in the absence (lanes 1, 5, and 9) or presence of the free H2A.Bbd-H2B dimers (1.5 pmol, lanes 2, 6, and 10), NCP3 (0.64 pmol of DNA, lanes 3, 7, and 11), or NCP4 (0.64 pmol of DNA, lanes 4, 8, and 12) and loaded on a 6% polyacrylamide gel in 0.5× Tris-borate-EDTA. DNA was visualized by EtBr staining (top panel), and then protein and DNA on the gel were transferred to a PVDF membrane followed by Western blotting with an anti-NAP-I antibody (middle panel). The same membrane was washed and proved with an anti-H2A.Bbd antibody (bottom panel). Positions of nucleosome N3 and N3*, DNA, the free dimer and NAP-I complexes, and free NAP-I were indicated to the right of the panels. D. Two-dimensional electrophoresis of NCPs treated with NAP-I. NCP3 (200 ng, 1.6 pmol) incubated in the presence of an excess of NAP-I (1,000 ng, 12 pmol) was incubated at 30°C for 30 min and separated on a native 6% polyacrylamide gel. DNA was visualized with EtBr staining (top panel). The lane containing NCPs was cut out and analyzed by 15% SDS-PAGE. Proteins and DNA were visualized with silver staining. Directions of electrophoresis are indicated by arrows. Positions of histones and DNA are indicated at the left of and under the panels. The band intensities of DNA and histones in the N3 and N3* positions were quantified by using NIH Image (bottom table). Right columns (ratio) of N3 and N3* indicate the amounts of histones when the amount of DNA was set as 1. E. NAP-I-mediated structural change of NCPs enhances the nuclease sensitivity. Naked DNA (lanes 1), NCP1 (lanes 2 and 3), and NCP3 (lanes 4 and 5) (0.8 pmol of DNA) preincubated without (lanes 1, 2, and 4) or with (6 pmol, lanes 3 and 5) NAP-I were subjected to DNase I digestion at 37°C for 15 s and 60 s. DNA was purified, separated on a 6% polyacrylamide gel containing 8 M urea in 1× Tris-borate-EDTA, and visualized with autoradiography. DNA size markers are indicated to the left of the panel.
FIG. 4.
FIG. 4.
NAP-I removes the histone H2A.Bbd-H2B dimers from the NCPs. A. NAP-I does not induce nucleosome sliding. NCP1 and NCP3 were assembled on the 5′-[32P]-labeled 5S rRNA gene fragment as shown in Fig. 2A. Naked DNA (lanes 1 and 2), NCP1 (lanes 3 and 4), and NCP3 (lanes 5 and 6) (100 ng, 0.8 pmol of DNA) were incubated in the absence (lanes 1, 3, and 5) or presence (lanes 2, 4, and 6) of excess amounts of NAP-I (500 ng, 6 pmol) followed by digestion with ExoIII. DNA was purified and analyzed by 6% PAGE with 8 M urea in 1× Tris-borate-EDTA. Positions of the major ExoIII posing sites that correspond to the nucleosome border are indicated by bullets. DNA size markers (lane M) and nucleosome positioning were shown at the right of the panel. B. Western blotting of the NCPs. NCP1 and NCP3 (100 ng, 0.8 pmol of DNA) were incubated at 30°C for 30 min without (lanes 1, 5, and 9) or with increasing amounts of NAP-I (100 ng [1.2 pmol] for lanes 2, 6, and 10, 200 ng [2.4 pmol] for lanes 3, 7, and 11, and 500 ng [6 pmol] for lanes 4, 8, and 12) followed by electrophoresis on a native 6% polyacrylamide gel. DNA was visualized with EtBr staining (lanes 1 to 4). DNA and proteins were transferred to a PVDF membrane, followed by Western blotting with anti-histone H3 and anti-histone H2A.Bbd antibodies (lanes 5 to 8 and 9 to 12, respectively). Positions of the NCPs (N1, N2, and N3), free DNA, and the free dimer-NAP-I complexes are indicated at the right side of the panel. C. NAP-I forms a complex with the H2A.Bbd-H2B dimers dissociated from the NCPs. Recombinant NAP-I (100 ng [1.2 pmol], 200 ng [2.4 pmol], and 500 ng [6 pmol]) for lanes 1 to 4, 5 to 8, and 9 to 12, respectively) were incubated in the absence (lanes 1, 5, and 9) or presence of the free H2A.Bbd-H2B dimers (1.5 pmol, lanes 2, 6, and 10), NCP3 (0.64 pmol of DNA, lanes 3, 7, and 11), or NCP4 (0.64 pmol of DNA, lanes 4, 8, and 12) and loaded on a 6% polyacrylamide gel in 0.5× Tris-borate-EDTA. DNA was visualized by EtBr staining (top panel), and then protein and DNA on the gel were transferred to a PVDF membrane followed by Western blotting with an anti-NAP-I antibody (middle panel). The same membrane was washed and proved with an anti-H2A.Bbd antibody (bottom panel). Positions of nucleosome N3 and N3*, DNA, the free dimer and NAP-I complexes, and free NAP-I were indicated to the right of the panels. D. Two-dimensional electrophoresis of NCPs treated with NAP-I. NCP3 (200 ng, 1.6 pmol) incubated in the presence of an excess of NAP-I (1,000 ng, 12 pmol) was incubated at 30°C for 30 min and separated on a native 6% polyacrylamide gel. DNA was visualized with EtBr staining (top panel). The lane containing NCPs was cut out and analyzed by 15% SDS-PAGE. Proteins and DNA were visualized with silver staining. Directions of electrophoresis are indicated by arrows. Positions of histones and DNA are indicated at the left of and under the panels. The band intensities of DNA and histones in the N3 and N3* positions were quantified by using NIH Image (bottom table). Right columns (ratio) of N3 and N3* indicate the amounts of histones when the amount of DNA was set as 1. E. NAP-I-mediated structural change of NCPs enhances the nuclease sensitivity. Naked DNA (lanes 1), NCP1 (lanes 2 and 3), and NCP3 (lanes 4 and 5) (0.8 pmol of DNA) preincubated without (lanes 1, 2, and 4) or with (6 pmol, lanes 3 and 5) NAP-I were subjected to DNase I digestion at 37°C for 15 s and 60 s. DNA was purified, separated on a 6% polyacrylamide gel containing 8 M urea in 1× Tris-borate-EDTA, and visualized with autoradiography. DNA size markers are indicated to the left of the panel.
FIG. 5.
FIG. 5.
Stability of NCPs containing H2A variants. A. Purification and refolding of the dimers containing histone H2A variants. His-tagged histone H2A, H2A.X, H2A.Z, the histone fold domain of macroH2A1.2 (mH2AN), and H2A.Bbd (lanes 1 to 5, respectively) were expressed in E. coli and purified as described in Materials and Methods. Purified histone variants refolded into dimers with H2B (lanes 1 to 5) and a H3-H4 tetramer (lane 6) were separated on a 15% SDS-PAGE and visualized with CBB staining. Lane M indicates molecular weight markers. B. Assembly of the NCPs containing histone H2A variants. Refolded dimers as shown in A were mixed with H3-H4 tetramers and used for assembly of NCPs. The NCPs assembled with histone octamers containing His-tagged H2A variants (indicated above each lane) were separated by 6% PAGE and visualized with EtBr staining. Positions of nucleosome and free DNA are indicated at the right of the panel. C. Stability of NCPs containing histone H2A variants in the presence of NAP-I. NCPs (100 ng, 0.8 pmol of DNA) containing His-tagged histone variants (indicated above the panel) were incubated in the absence (lanes 1, 5, 9, 13, and 17) or presence of increasing amounts of NAP-I (100 ng [1.2 pmol], 200 ng [2.4 pmol], and 500 ng [6 pmol] for lanes 2, 6, 10, 14, and 18; 3, 7, 11, 15, and 19; and 4, 8, 12, 16, and 20, respectively), followed by a nucleoprotein gel analysis. DNA was visualized with EtBr staining (top panel), and His-tagged histones and histone H3 were detected by Western blotting using anti-His (middle panel) and anti-histone H3 (bottom panel) antibodies, respectively. Positions of nucleosome (Nuc), free dimer-NAP-I complexes, and DNA are shown to the right of the panels.
FIG. 6.
FIG. 6.
Effect of the H3 variant, H3.3, on NAP-I-mediated removal of the H2A.Bbd-H2B dimers from NCPs. A. Nucleoprotein gel analysis of NCP3 and NCP4 preincubated with NAP-I. NCPs were assembled with histone octamers containing H2A.Bbd, H2B, H3, and H4 (NCP3, lanes 1 to 4) or H2A.Bbd, H2B, H3.3, and H4 (NCP4, lanes 5 to 8). NCPs (100 ng, 0.8 pmol of DNA) incubated without (lanes 1 and 5) or with increasing amounts of NAP-I (100 ng [1.2 pmol, lanes 2 and 6], 200 ng ′2.4 pmol, lanes 3 and 7], and 500 ng [6 pmol, lanes 4 and 8]) were analyzed by nucleoprotein gel analysis and Western blotting with an anti-H2A.Bbd antibody (top and bottom panels, respectively). B. Quantitative analysis of the dimer removal by NAP-I from NCP3 and NCP4 under different temperature conditions. NCP3 and NCP4 (0.4 pmol of DNA) were incubated with increasing amounts of NAP-I (1.2, 2.4, 4.8, and 12 pmol) at 4°C or 37°C for 1 h and subjected to the nucleoprotein gel analysis followed by Western blotting with an anti-H2A.Bbd antibody. The ratios of the H2A.Bbd-H2B dimers removed from the NCPs were quantitatively analyzed by using NIH Image and plotted as a function of the amounts of NAP-I. The amounts of H2A.Bbd derived from NCP3 at 4°C, NCP3 at 37°C, NCP4 at 4°C, and NCP4 at 37°C are indicated by filled circles, filled squares, blank circles, and blank squares, respectively. Data shown were from the averages for two independent experiments.
FIG. 7.
FIG. 7.
Reversible assembly and disassembly of the H2A.Bbd-H2B dimers by NAP-I. A. Removal of the nontagged dimers from the NCPs and replacement with the His-tagged dimers by NAP-I. His-tagged H2A-H2B dimers (lanes 3 to 5, 11 to 13, 19 to 21, and 27 to 29) or His-tagged H2A.Bbd-H2B dimers (lanes 6 to 8, 14 to 16, 22 to 24, and 30 to 32) (50 ng, 2 pmol of the dimers each) were preincubated with increasing amounts of NAP-I (200 ng [2.4 pmol], 400 ng [4.8 pmol], 1,000 ng [12 pmol]) as indicated at the top of the panel. Then, the dimer-NAP-I complexes were mixed with the nontagged NCPs (80 ng, 0.6 pmol of DNA) and further incubated at 30°C for 1 h followed by nucleoprotein gel analysis. DNA was visualized with EtBr staining (top panel), and proteins were analyzed by Western blotting with anti-His (middle panel) and anti-H2A.Bbd (bottom panel) antibodies. Positions of DNA and NCPs are indicated to the right of the panels. Bullets shown at the right side of lanes 5, 13, 21, and 29 indicate what could be intermediate NCPs (see the text). B. Removal of the His-tagged dimers from the NCPs and replacement with the nontagged dimers by NAP-I. Increasing amounts of NAP-I (0, 1.2, 2.4, 4.8, and 12 pmol) were preincubated without (lanes 1 to 5 and 16 to 20) or with nontagged H2A-H2B dimers (1.5 pmol, lanes 6 to 10 and 21 to 25) or nontagged H2A.Bbd-H2B dimers (1.5 pmol, lanes 11 to 15 and 26 to 30). The complexes were mixed and incubated with NCP3 (lanes 1 to 15) or NCP4 (lanes 16 to 30) (0.4 pmol of DNA each) that was assembled with histones containing His-tagged H2A.Bbd at 30°C for 1 h, followed by analysis with 6% PAGE in 0.5× Tris-borate-EDTA. DNA was visualized with EtBr staining (top panel), and the protein and DNA were transferred to a PVDF membrane, followed by Western blotting with an anti-His-tag antibody (bottom panel). The amounts of His-tagged H2A.Bbd in the N3 nucleosome position were quantitatively analyzed by using NIH Image and plotted as a function of the amounts of NAP-I (bottom graphs). Several independent experiments showed similar results, and the graphs shown below the panels were from the results shown in this figure.

Similar articles

Cited by

References

    1. Ahmad, K., and S. Henikoff. 2002. The histone variant H3.3 marks active chromatin by replication-independent nucleosome assembly. Mol. Cell 9:1191-1200. - PubMed
    1. Akey, C. W., and K. Luger. 2003. Histone chaperones and nucleosome assembly. Curr. Opin. Struct. Biol. 13:6-14. - PubMed
    1. Anderson, J. D., A. Thastrom, and J. Widom. 2002. Spontaneous access of proteins to buried nucleosomal DNA target sites occurs via a mechanism that is distinct from nucleosome translocation. Mol. Cell. Biol. 22:7147-7157. - PMC - PubMed
    1. Bao, Y., K. Konesky, Y. J. Park, S. Rosu, P. N. Dyer, D. Rangasamy, D. J. Tremethick, P. J. Laybourn, and K. Luger. 2004. Nucleosomes containing the histone variant H2A.Bbd organize only 118 base pairs of DNA. EMBO J. 23:3314-3324. - PMC - PubMed
    1. Belotserkovskaya, R., S. Oh, V. A. Bondarenko, G. Orphanides, V. M. Studitsky, and D. Reinberg. 2003. FACT facilitates transcription-dependent nucleosome alteration. Science 301:1090-1093. - PubMed

Publication types