

Structure and activity of the axon guidance protein MICAL
- PMID: 16275926
- PMCID: PMC1277968
- DOI: 10.1073/pnas.0504838102
Structure and activity of the axon guidance protein MICAL
Abstract
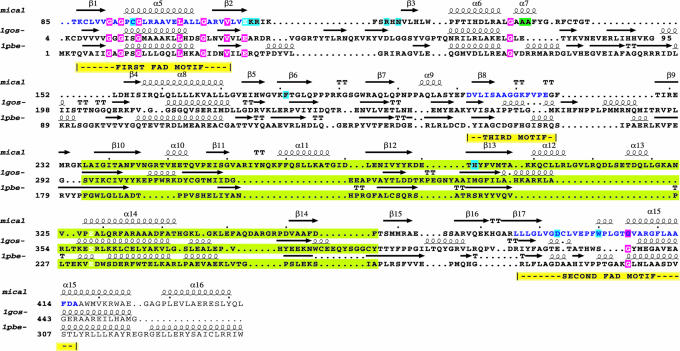
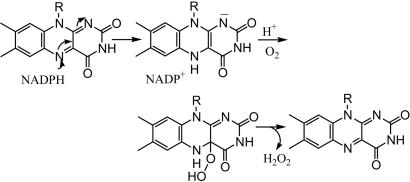
During development, neurons are guided to their targets by short- and long-range attractive and repulsive cues. MICAL, a large multidomain protein, is required for the combined action of semaphorins and plexins in axon guidance. Here, we present the structure of the N-terminal region of MICAL (MICAL(fd)) determined by x-ray diffraction to 2.0 A resolution. The structure shows that MICAL(fd) is an FAD-containing module structurally similar to aromatic hydroxylases and amine oxidases. In addition, we present biochemical data that show that MICAL(fd) is a flavoenzyme that in the presence of NADPH reduces molecular oxygen to H(2)O(2) (K(m,NAPDH) = 222 microM; k(cat) = 77 sec(-1)), a molecule with known signaling properties. We propose that the H(2)O(2) produced by this reaction may be one of the signaling molecules involved in axon guidance by MICAL.
Figures


Similar articles
-
High-resolution structure of the catalytic region of MICAL (molecule interacting with CasL), a multidomain flavoenzyme-signaling molecule.Proc Natl Acad Sci U S A. 2005 Nov 15;102(46):16836-41. doi: 10.1073/pnas.0504997102. Epub 2005 Nov 7. Proc Natl Acad Sci U S A. 2005. PMID: 16275925 Free PMC article.
-
MICAL flavoprotein monooxygenases: structure, function and role in semaphorin signaling.Adv Exp Med Biol. 2007;600:38-51. doi: 10.1007/978-0-387-70956-7_4. Adv Exp Med Biol. 2007. PMID: 17607945 Review.
-
Modulation of MICAL Monooxygenase Activity by its Calponin Homology Domain: Structural and Mechanistic Insights.Sci Rep. 2016 Mar 3;6:22176. doi: 10.1038/srep22176. Sci Rep. 2016. PMID: 26935886 Free PMC article.
-
Structure-function studies of MICAL, the unusual multidomain flavoenzyme involved in actin cytoskeleton dynamics.Arch Biochem Biophys. 2017 Oct 15;632:118-141. doi: 10.1016/j.abb.2017.06.004. Epub 2017 Jun 8. Arch Biochem Biophys. 2017. PMID: 28602956 Review.
-
Actin stimulates reduction of the MICAL-2 monooxygenase domain.Biochemistry. 2013 Sep 3;52(35):6076-84. doi: 10.1021/bi4008462. Epub 2013 Aug 21. Biochemistry. 2013. PMID: 23927065
Cited by
-
MICAL, the flavoenzyme participating in cytoskeleton dynamics.Int J Mol Sci. 2013 Mar 27;14(4):6920-59. doi: 10.3390/ijms14046920. Int J Mol Sci. 2013. PMID: 23535333 Free PMC article. Review.
-
Toward rational protein crystallization: A Web server for the design of crystallizable protein variants.Protein Sci. 2007 Aug;16(8):1569-76. doi: 10.1110/ps.072914007. Protein Sci. 2007. PMID: 17656576 Free PMC article.
-
MICAL-mediated oxidation of actin and its effects on cytoskeletal and cellular dynamics.Front Cell Dev Biol. 2023 Feb 17;11:1124202. doi: 10.3389/fcell.2023.1124202. eCollection 2023. Front Cell Dev Biol. 2023. PMID: 36875759 Free PMC article. Review.
-
Extracellular inhibitors, repellents, and semaphorin/plexin/MICAL-mediated actin filament disassembly.Cytoskeleton (Hoboken). 2011 Aug;68(8):415-33. doi: 10.1002/cm.20527. Epub 2011 Aug 25. Cytoskeleton (Hoboken). 2011. PMID: 21800438 Free PMC article. Review.
-
MICAL-family proteins: Complex regulators of the actin cytoskeleton.Antioxid Redox Signal. 2014 May 1;20(13):2059-73. doi: 10.1089/ars.2013.5487. Epub 2013 Aug 17. Antioxid Redox Signal. 2014. PMID: 23834433 Free PMC article. Review.
References
-
- Winberg, M. L., Noordermeer, J. N., Tamagnone, L., Comoglio, P. M., Spriggs, M. K., Tessier-Lavigne, M. & Goodman, C. S. (1998) Cell 95, 903-916. - PubMed
-
- Terman, J. R., Mao, T., Pasterkamp, R. J., Yu, H. H. & Kolodkin, A. L. (2002) Cell 109, 887-900. - PubMed
-
- Fischer, J., Weide, T. & Barnekow, A. (2005) Biochem. Biophys. Res. Commun. 328, 415-423. - PubMed
-
- Weide, T., Teuber, J., Bayer, M. & Barnekow, A. (2003) Biochem. Biophys. Res. Commun. 306, 79-86. - PubMed
-
- Suzuki, T., Nakamoto, T., Ogawa, S., Seo, S., Matsumura, T., Tachibana, K., Morimoto, C. & Hirai, H. (2002) J. Biol. Chem. 277, 14933-14941. - PubMed
Publication types
MeSH terms
Substances
Associated data
- Actions
Grants and funding
LinkOut - more resources
Full Text Sources
Molecular Biology Databases
Miscellaneous
