. 2005 Dec;6(12):1263-71.
doi: 10.1038/ni1267. Epub 2005 Nov 6.

Interleukin 15 controls the generation of the restricted T cell receptor repertoire of gamma delta intestinal intraepithelial lymphocytes

Affiliations

Interleukin 15 controls the generation of the restricted T cell receptor repertoire of gamma delta intestinal intraepithelial lymphocytes

Hang Zhao et al. Nat Immunol. 2005 Dec.

Abstract

The gammadelta T cells are prevalent in the mucosal epithelia and are postulated to act as 'sentries' for maintaining tissue integrity. What these gammadelta T cells recognize is poorly defined, but given the restricted T cell receptor (TCR) repertoire, the idea that they are selected by self antigens of low complexity has been widely disseminated. Here we present data showing that the generation of the restricted TCR variable gamma-region gene repertoire of intestinal intraepithelial lymphocytes was regulated by interleukin 15, which induced local chromatin modifications specific for the variable gamma-region gene segment and enhanced accessibility conducive to subsequent targeted gene rearrangement. This cytokine-directed tissue-specific TCR repertoire formation probably reflects distinct TCR repertoire selection criteria for gammadelta and alphabeta T cell lineages adopted for different antigen-recognition strategies.
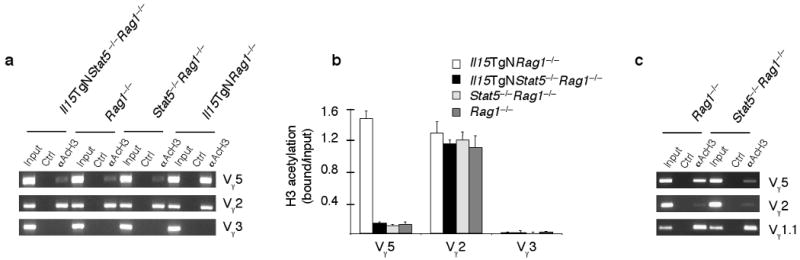

Figures

Figure 1
Figure 1
Generation of Vγ5+ γδ thymocytes by IL-15 in the absence of IL-7 signaling. (a) Development of γδTCR+ thymocytes in FTOC (5-7 days) of E14 Il7r-/- lobes in the presence of IL-15 (10ng/ml). Cultures with IL-7 (left) were used as negative controls. For the middle profile, percentage of Vγ5+ cells refers to the boxed area. Total thymocyte numbers in each culture ranged from 1.5 × 10⁵ to 3.8 × 10⁶/lobe when IL-15 was added (n=15) and <1 × 10⁵ to 1.4 × 10⁶/lobe (n= 22) when other cytokines were included. (b, c) Flow cytometric analysis of Il15TgNIl7r-/- mice (4-8 weeks old). Analysis of thymocytes (top, n=6), nylon-wool passed spleen cells (NWPS) enriched for T cells (middle, n=9) and i-IELs (bottom, n=8), stained for the indicated markers, is shown. Numbers in the plots indicate percentage of the total (± SEM). In (c), profiles show CD8α or CD8β expression on gated γδTCR+ cells. (d) Flow cytometric analysis of CD4-CD8- γδTCR+ thymocyte subsets in 1 day old mice with defects in IL-15 signaling. Total thymocyte numbers were comparable in Il15-/- and B6 newborn mice, but reduced to 1/3 to 1/2 in Fl-Stat5-/- animals. Numbers in the plots indicate average percentage of the total (± SEM) based on the analyses of minimum of three mice of each genotype. (e) RT-PCR analysis for rearranged Tcrg gene transcripts in Il7r-/- tissues with different concentrations of IL-15. Relative tubulin (Tubb) mRNA amounts were used as loading controls. One of two independent experiments with similar results is shown. (f) A schematic depiction of the murine TCR Cγ1 cluster (not to scale) showing the relative position of Vγ genes and two cis-acting regulatory sequences, 3′ECγ1 and HsA. Vγ-specific primers for all ChIP experiments are from the promoter regions (black boxes).
Figure 2
Figure 2
Histone acetylation patterns correlate with Vγ gene usage. (a) Semi-quantitative PCR assay (5-fold serial dilution series, one of two experiments) for Tcrg gene rearrangement in thymocytes of various γc cytokine signaling-defective mice compared to B6 controls. (b) LM-PCR assay to determine relative abundance of RAG-mediated DNA cleavage at Vγ5 and Vγ2 RSSs in thymocytes of various genotype. For PCR, genomic DNA samples were used at the highest dilution for B6 and Il15-/- thymocytes (left two lanes, ≈100ng of ligated DNA), while 5-fold serial dilution series were used (≈100ng and 20ng) for the rest of the samples. Amounts of Tubb PCR products were used to normalize for input DNA quantity. One of three experiments with similar results is shown. (c) ChIP assay for the relative presence of AcH3 in HsA, 3′ECγ1, the promoter regions of Vγ5, Vγ2, Vγ3 gene segments, the immediate 5′ upstream region of Jγ1 gene segment and positive control Gaphd promoter in thymocytes of Il15TgNIl7r-/-, Il7r-/- and control Il7r+/- mice. Control (Ctrl) lanes represent no Ab added during immunoprecipitation for all ChIP experiments. Results shown are representative of three independent experiments. (d) Quantitative real-time ChIP data of the experiment described in c. The ratios of co-immunoprecipated DNA (AcH3 bound) over arbitrary DNA input quantitative PCR assay control (input) are the mean ± SEM of triplicate data points from a representative experiment (one of three) using pooled thymocytes from 4 mice of each genotype. Jγ1 and Gaphd gene regions were not examined quantitatively. (e) Quantitative real-time ChIP assay for relative AcH3 associated with the Vγ5 versus Vγ2 promoter regions of Rag1-/- mice of 129 or B6 strain.
Figure 3
Figure 3
IL-15 regulates transcriptional activity and alters histone chromatin modification specifically at the Vγ5 gene segment independent of RAG-mediated Tcrg gene rearrangement in thymocytes. (a) A representative semi-quantitative RT-PCR assay (one of four experiments) for relative amounts of un-rearranged sterile Vγ gene-specific transcripts in thymocytes of Rag1-/- mice exposed to different amounts of IL-15. A 5-fold serial cDNA sample dilution series is shown. RT, no reverse transcriptase control. (b, c) ChIP assays for relative AcH3 patterns across the TcrCγ1 cluster in thymocytes of Rag1-/- mice with differing amounts of IL-15. Shown are a representative agarose gel (b) and quantitative real-time PCR assay (c). In b, input DNA control was serially diluted 4-fold. In c, bound/input DNA ratios are the mean ± SEM of triplicate data points from a representative experiment (one of three) using pooled thymocytes from 4 mice of each genotype. (d) Quantitative real-time ChIP assay for relative AcH3 patterns across the TcrCγ1 cluster in sorted (>95% pure) precursor TN thymocytes of Il15TgN or control B6 mice. Bound/input DNA ratios are the mean ± SEM of triplicate data points. One of two independent experiments with similar results is shown.
Figure 4
Figure 4
Comparison of Vγ5 gene segment-specific transcriptional activity and chromatin accessibility in the intestine versus thymus. (a) A representative semi-quantitative RT-PCR assay (one of 5 experiments) for relative abundance of un-rearranged sterile Vγ gene-specific transcripts in thymocytes versus intestinal intraepithelial cell preparations of Rag1-/- mice. A 5-fold serial cDNA sample dilution series is shown. RT, no reverse transcriptase control. (b) A representative ChIP assay (one of three) for the relative abundance of AcH3 in the promoter regions of Vγ5, Vγ2, Vγ3 gene segments in intestinal intraepithelial cell preparations of Rag1-/- mice with differing amounts of IL-15 (4 to 5 mice of each genotype). (c) Quantitative real-time ChIP data of the experiment described in b. Ratios are the mean ± SEM of triplicate data points from a representative experiment (one of three) using pooled cells from 4 mice. * denotes statistically significant difference (P < 0.05, Student's t test). (d) A representative ChIP assay (one of three) for the relative presence of AcH3 in the promoter regions of Vγ5, Vγ2, Vγ3 gene segments and the 5′ upstream region of Jγ1 gene segment in intestinal intraepithelial cell preparations of Il7r-/- mice with or without Il15TgN expression. Relative AcH3 amounts at the Gapdh promoter were used as positive control for the assay. (e) Quantitative real-time ChIP data of the experiment described in d. Ratios are the mean ± SEM of triplicate data points from a representative experiment (one of two) using pooled cells from 4 mice. Jγ1 and Gapdh gene regions were not examined quantitatively.
Figure 5
Figure 5
Increased AcH3 modification at the Vγ5 gene segment that results from Il15TgN expression is dependent on FL-STAT5. (a) A representative ChIP assay (one of three experiments) for the relative abundance of AcH3 in the promoter regions of Vγ5, Vγ2, Vγ3 gene segments in thymocytes of Il15TgNRag1-/-mice with or without FL-STAT5. (b) Quantitative real-time ChIP data of the experiment described in a, assessing relative amounts of AcH3 associated with specific Vγ gene promoters. Ratios are the mean ± SEM of triplicate data points from a representative experiment (one of two) using pooled thymocytes from 3 mice. (c) A representative semi-quantitative ChIP assay (one of two) for the relative presence of AcH3 in the promoter regions of indicated Vγ gene segments in intestinal intraepithelial cell preparations of Rag1-/- mice with or without FL-STAT5.

Similar articles

Cited by

References

    1. Chen Y, Chou K, Fuchs E, Havran WL, Boismenu R. Protection of the intestinal mucosa by intraepithelial γδ T cells. Proc Natl Acad Sci USA. 2002;99:14338–14343. - PMC - PubMed
    1. Jameson J, et al. A role for skin γδ T cells in wound repair. Science. 2002;296:747–749. - PubMed
    1. Cheroutre H. Starting at the beginning: new perspectives on the biology of mucosal T cells. Annu Rev Immunol. 2004;22:217–246. - PubMed
    1. Eberl G, Littman DR. Thymic origin of intestinal αβ T Cells Revealed by Fate Mapping of RORγt+ Cells. Science. 2004;305:248–251. - PubMed
    1. Goodman T, LeFrancois L. Intraepithelial lymphocytes. Anatomical site, not T cell receptor form, dictates phenotype and function. J Exp Med. 1989;170:1569–1581. - PMC - PubMed

MeSH terms

LinkOut - more resources