The eukaryotic initiation factor (eIF) 5 HEAT domain mediates multifactor assembly and scanning with distinct interfaces to eIF1, eIF2, eIF3, and eIF4G
- PMID: 16254050
- PMCID: PMC1283452
- DOI: 10.1073/pnas.0507960102
The eukaryotic initiation factor (eIF) 5 HEAT domain mediates multifactor assembly and scanning with distinct interfaces to eIF1, eIF2, eIF3, and eIF4G
Abstract
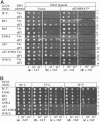
Eukaryotic translation initiation factor (eIF) 5 is crucial for the assembly of the eukaryotic preinitiation complex. This activity is mediated by the ability of its C-terminal HEAT domain to interact with eIF1, eIF2, and eIF3 in the multifactor complex and with eIF4G in the 48S complex. However, the binding sites for these factors on eIF5-C-terminal domain (CTD) have not been known. Here we present a homology model for eIF5-CTD based on the HEAT domain of eIF2Bepsilon. We show that the binding site for eIF2beta is located in a surface area containing aromatic and acidic residues (aromatic/acidic boxes), that the binding sites for eIF1 and eIF3c are located in a conserved surface region of basic residues, and that eIF4G binds eIF5-CTD at an interface overlapping with the acidic area. Mutations in these distinct eIF5 surface areas impair GCN4 translational control by disrupting preinitiation complex interactions. These results indicate that the eIF5 HEAT domain is a critical nucleation core for preinitiation complex assembly and function.
Figures


Similar articles
-
Physical association of eukaryotic initiation factor (eIF) 5 carboxyl-terminal domain with the lysine-rich eIF2beta segment strongly enhances its binding to eIF3.J Biol Chem. 2004 Nov 26;279(48):49644-55. doi: 10.1074/jbc.M409609200. Epub 2004 Sep 17. J Biol Chem. 2004. PMID: 15377664
-
Sequential eukaryotic translation initiation factor 5 (eIF5) binding to the charged disordered segments of eIF4G and eIF2β stabilizes the 48S preinitiation complex and promotes its shift to the initiation mode.Mol Cell Biol. 2012 Oct;32(19):3978-89. doi: 10.1128/MCB.00376-12. Epub 2012 Jul 30. Mol Cell Biol. 2012. PMID: 22851688 Free PMC article.
-
Eukaryotic initiation factor (eIF) 1 carries two distinct eIF5-binding faces important for multifactor assembly and AUG selection.J Biol Chem. 2008 Jan 11;283(2):1094-103. doi: 10.1074/jbc.M708155200. Epub 2007 Nov 1. J Biol Chem. 2008. PMID: 17974565
-
A multifactor complex of eIF1, eIF2, eIF3, eIF5, and tRNA(i)Met promotes initiation complex assembly and couples GTP hydrolysis to AUG recognition.Cold Spring Harb Symp Quant Biol. 2001;66:403-15. doi: 10.1101/sqb.2001.66.403. Cold Spring Harb Symp Quant Biol. 2001. PMID: 12762043 Review. No abstract available.
-
The scanning mechanism of eukaryotic translation initiation.Annu Rev Biochem. 2014;83:779-812. doi: 10.1146/annurev-biochem-060713-035802. Epub 2014 Jan 29. Annu Rev Biochem. 2014. PMID: 24499181 Review.
Cited by
-
The eukaryotic initiation factor (eIF) 4G HEAT domain promotes translation re-initiation in yeast both dependent on and independent of eIF4A mRNA helicase.J Biol Chem. 2010 Jul 16;285(29):21922-33. doi: 10.1074/jbc.M110.132027. Epub 2010 May 12. J Biol Chem. 2010. PMID: 20463023 Free PMC article.
-
Mechanisms of translational regulation by a human eIF5-mimic protein.Nucleic Acids Res. 2011 Oct;39(19):8314-28. doi: 10.1093/nar/gkr339. Epub 2011 Jul 10. Nucleic Acids Res. 2011. PMID: 21745818 Free PMC article.
-
mRNA helicases: the tacticians of translational control.Nat Rev Mol Cell Biol. 2011 Apr;12(4):235-45. doi: 10.1038/nrm3083. Nat Rev Mol Cell Biol. 2011. PMID: 21427765 Review.
-
eIF3a cooperates with sequences 5' of uORF1 to promote resumption of scanning by post-termination ribosomes for reinitiation on GCN4 mRNA.Genes Dev. 2008 Sep 1;22(17):2414-25. doi: 10.1101/gad.480508. Genes Dev. 2008. PMID: 18765792 Free PMC article.
-
Coordinated movements of eukaryotic translation initiation factors eIF1, eIF1A, and eIF5 trigger phosphate release from eIF2 in response to start codon recognition by the ribosomal preinitiation complex.J Biol Chem. 2013 Feb 22;288(8):5316-29. doi: 10.1074/jbc.M112.440693. Epub 2013 Jan 4. J Biol Chem. 2013. PMID: 23293029 Free PMC article.
References
-
- Hershey, J. W. B. & Merrick, W. C. (2000) in Translational Control of Gene Expression, eds. Sonenberg, N., Hershey, J. W. B. & Mathews, M. B. (Cold Spring Harbor Lab. Press, Plainview, NY), pp. 33–88.
-
- Singh, C. R., Yamamoto, Y. & Asano, K. (2004) J. Biol. Chem. 279, 49644–49655. - PubMed
Publication types
MeSH terms
Substances
Grants and funding
LinkOut - more resources
Full Text Sources
Miscellaneous

