. 2005 Nov;115(11):3166-76.
doi: 10.1172/JCI25001. Epub 2005 Oct 20.

Activation of Notch1 signaling is required for beta-catenin-mediated human primary melanoma progression

Affiliations

Activation of Notch1 signaling is required for beta-catenin-mediated human primary melanoma progression

Klara Balint et al. J Clin Invest. 2005 Nov.

Abstract

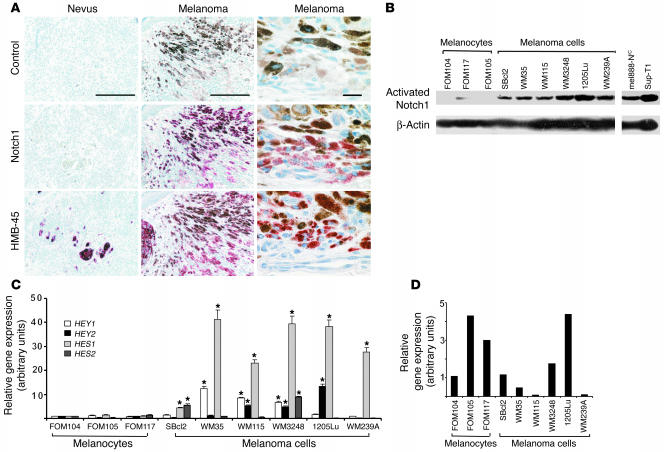
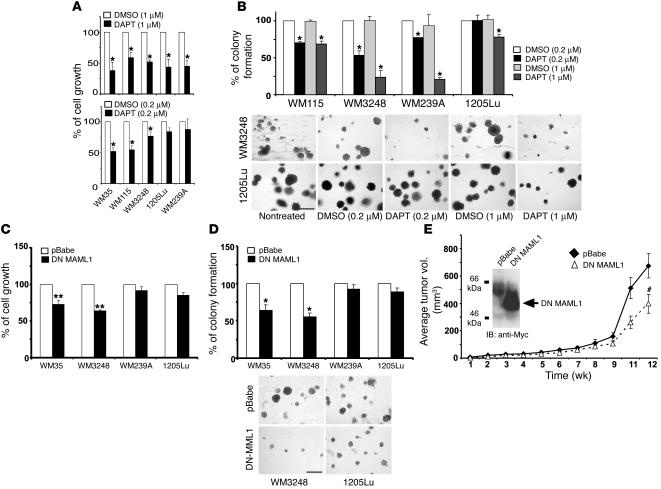
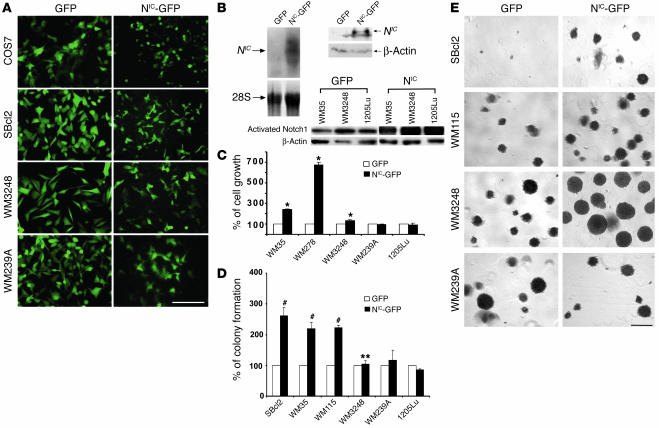
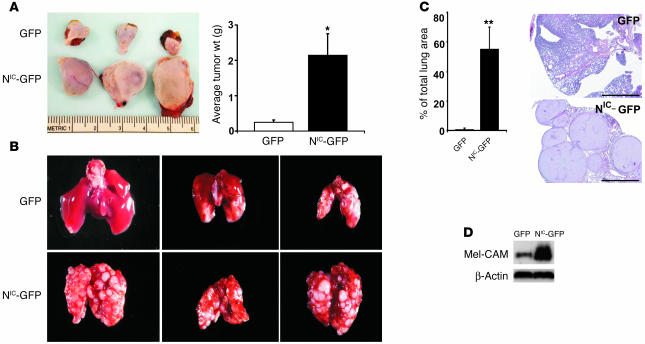
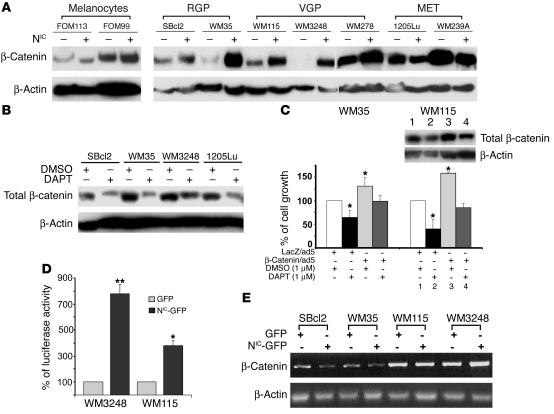
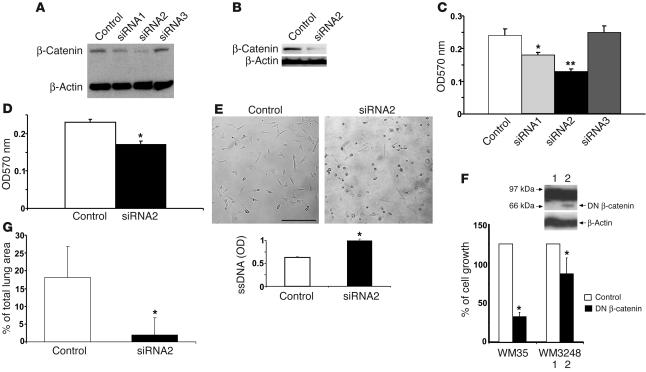
Notch is a highly conserved transmembrane receptor that determines cell fate. Notch signaling denotes cleavage of the Notch intracellular domain, its translocation to the nucleus, and subsequent activation of target gene transcription. Involvement of Notch signaling in several cancers is well known, but its role in melanoma remains poorly characterized. Here we show that the Notch1 pathway is activated in human melanoma. Blocking Notch signaling suppressed whereas constitutive activation of the Notch1 pathway enhanced primary melanoma cell growth both in vitro and in vivo yet had little effect on metastatic melanoma cells. Activation of Notch1 signaling enabled primary melanoma cells to gain metastatic capability. Furthermore, the oncogenic effect of Notch1 on primary melanoma cells was mediated by beta-catenin, which was upregulated following Notch1 activation. Inhibiting beta-catenin expression reversed Notch1-enhanced tumor growth and metastasis. Our data therefore suggest a beta-catenin-dependent, stage-specific role for Notch1 signaling in promoting the progression of primary melanoma.


Figures

Figure 1
Figure 1
Expression of Notch pathway components in human melanocytes and melanoma cells. (A) Immunohistochemistry for Notch1 in primary lesions of human malignant melanoma and in nevi. Specimens were stained using standard immunoperoxidase methods. Reddish staining indicates Notch1 positivity whereas brown staining indicates melanin. Negative control was stained with isotype-matched secondary antibodies. HMB45 staining confirmed melanocytic origin. Scale bars: 200 μm. High-magnification images are shown in the right column. Scale bar: 20 μm. (B) Western blot analysis for the levels of activated Notch1 in human melanocytes and melanoma cell lines. Increased levels of activated Notch1 in most melanoma cell lines compared with melanocytes. β-actin was used as loading control. (C) HEY1, HEY2, HES1, and HES2 mRNA expression in normal and malignant melanocytic cells as determined by quantitative real-time RT-PCR. Results are mean ± SD of 3 independent experiments. *P < 0.05, Student’s t test. (D) Relative amounts of JAGGED1 mRNA expression in normal and malignant melanocytic cells as determined by quantitative real-time RT-PCR. Results are mean ± SD of 3 independent experiments.
Figure 2
Figure 2
Suppression of Notch signaling inhibits melanoma cell growth. (A) Cells were treated with DAPT (0.2 μM and 1 μM) and compared with equal volume of solvent DMSO. Cell growth was analyzed by MTT. Results indicate percentage of cell growth compared with controls (adjusted to 100%). *P < 0.005, Student’s t test. (B) Colonies formed in soft agar were counted and photographed after 10 days incubation. Graphs and representative photographs from each condition are shown. Scale bar: 500 μm. Results are mean ± SD of 3 independent experiments. (C) Growth of cells transfected with DN MAML1/pBabe was analyzed by MTT. Results are mean ± SD of 3 independent experiments. **P < 0.001, Student’s t test. (D) Number of colonies of cells transfected with DN MAML1/pBabe or pBabe (mock). Results are mean ± SD of 3 independent experiments. Representative photos are shown. Scale bar: 500 μm. (E) Effect of DN MAML1 on WM3248 cell growth was assessed in SCID mice. Tumor size was measured at indicated times after subcutaneous injection. Results are mean ± SD (n = 8). #P = 0.024, Student’s t test. Inner panel, WM3248 cells were transfected with DN MAML1/pBabe or pBabe. Immunoblots confirmed Myc-tagged DN MAML1 expression.
Figure 3
Figure 3
Constitutive activation of Notch1 pathway enhances melanoma growth in vitro. (A) Cells were transfected with either NIC-GFP or GFP. Equal numbers of stable transfectants were plated and photographed after 4 hours under fluorescence microscopy. Scale bar: 20 μm. More than 95% of green cells were observed in all other melanoma cell lines. (B) Upper panel shows COS7 cells transfected with NIC-GFP or GFP lentiviruses were analyzed by Northern (left) and Western (right) blot. NIC gene and protein expression are shown. 28S rRNA and β-actin were used as controls for Northern and Western blots, respectively. Lower panel shows expression of activated Notch1 in melanoma transfectants as detected by Western blot. (C) Cell growth was measured by 3[H]-thymidine incorporation assays. Ectopic expression of NIC accelerated primary melanoma but did not affect metastatic melanoma cell growth. Data were normalized by setting the activities of GFP-transfected control cells at 100. Results are mean ± SD from triplicates in 3 independent experiments. *P < 0.005, Student’s t test. (D) Percentage of colonies formed in soft agar. NIC enhances colony formation of primary but not metastatic melanoma cells. **Note that colonies formed by WM3248-NIC-GFP cells are larger than those of control, although the numbers are not significantly increased. Data were normalized by setting the activities of GFP-transfected control cells as 100. Results are mean ± SD from independent experiments. #P < 0.001, Student’s t test. (E) Representative fields in soft agar plates. Scale bar: 500 μm.
Figure 4
Figure 4
Activated Notch1 increases primary melanoma growth and promotes lung metastasis in adult mice. (A) 3 × 10⁶ WM35-NIC-GFP or WM35-GFP cells were injected subcutaneously into mice, respectively. Mice were sacrificed after 7 weeks, and tumor samples were harvested, measured, and photographed. Representative photos of harvested melanoma (with skin) from 3 samples of each group are shown (left panel). Total tumor weight (g) from each group of mice was calculated and shown (right panel). Data are mean ± SD. *P = 0.006, Student’s t test. (B) WM3248-NIC-GFP or WM3248-GFP cells were injected intravenously into SCID mice. Mice were sacrificed after 7 weeks, and lungs were harvested. Representative lungs from each group are shown: GFP (upper panel) and NIC-GFP (lower panel). (C) Section of lungs from WM3248-NIC-GFP– and WM3248-GFP–injected mice (right panel). Percentage of total area occupied by lung tumor was measured using Image-Pro Plus Phase 3 Imaging System (MediaCybernetics) based on H&E stained sections. Data are mean ± SD. **P < 0.005, Student’s t test. Scale bars: 1 mm. (D) Activated Notch1 upregulates Mel-CAM expression on melanoma cells. Immunoblotting analysis of whole-cell lysates of NIC-GFP- or GFP-transfected WM3248 cells demonstrates increased levels of Mel-CAM in NIC–GFP–transfected but not GFP-transfected cells. Levels of β-actin are shown for equal loading conditions.
Figure 5
Figure 5
Activation of Notch1 signaling stabilizes β-catenin in primary melanoma cell lines. (A) Immunoblotting analysis demonstrates increased levels of β-catenin in NIC–GFP-transfected RGP and VGP primary melanomas but not in NIC–GFP-transfected melanocytes or metastatic melanoma cells. Levels of β-actin are shown for equal loading conditions. (B) DAPT treatment inhibits β-catenin expression in melanoma cells. Cells were treated with 1 μM DAPT for 24 hours, and whole-cell lysates were analyzed by immunoblotting assays. Levels of β-actin are shown for equal loading conditions. (C) Introducing exogenous β-catenin overrides the inhibitory effect of DAPT on primary melanoma cell growth. β-catenin/adenovirus–transfected melanoma cells were treated with DAPT (1 μM) or DMSO. Overexpression of β-catenin accelerated cell growth as measured by MTT assay. Inner panel shows detection of β-catenin expression by immunoblot. Although DAPT suppressed cell proliferation, the growth rate was comparable to that of parental cells not treated with DAPT. Results are mean ± SD of 3 independent experiments. *P < 0.01, Student’s t test. (D) Luciferase assay demonstrates an enhanced TCF-mediated transcription activity in NIC–GFP-transfected cells compared with control cells. Data were normalized by setting the luciferase activities of control cells as 100. Results are mean ± SD of 3 independent experiments. **P < 0.001, Student’s t test. (E) RT-PCR analysis demonstrates that RNA levels of β-catenin are not concurrently upregulated in the NIC–GFP-transfected RGP and VGP cell lines, suggesting a posttranscriptional mechanism in stabilizing β-catenin. β-actin was used as control.
Figure 6
Figure 6
Suppressing β-catenin reverses Notch1-induced tumor growth and metastasis. (A and B) β-catenin was examined by immunoblotting in WM35–NIC-GFP cells expressing β-cat–siRNA1, β-cat–siRNA2, β-cat–siRNA3 and control vector (A) and in WM3248–NIC-GFP cells expressing β-cat–siRNA2 (B). β-cat–si–RNA2 efficiently suppressed expression of β-catenin. β-actin was used as loading control. (C and D) MTT assay shows a decreased growth rate induced by β-cat–siRNA1 (*P < 0.01, Student’s t test) and β-cat–siRNA2 (**P < 0.001, Student’s t test) in WM35–NIC-GFP cells and β-cat–siRNA2 in WM3248-NIC-GFP cells when compared with control. Results are mean ± SD from triplicates of 3 independent experiments. (E) Induction of cell apoptosis by β-cat–siRNA2 in WM35–NIC-GFP cells. Round shape indicates cell death. Scale bar: 20 μm. Cell apoptosis was quantitatively measured by ELISA. Results are mean ± SD from triplicates of 3 independent experiments. Similar results were observed in WM3248–NIC-GFP cells. (F) 3[H]-Thymidine incorporation assay shows a decreased growth rate of WM3248 cells transfected with DN β-catenin compared with the control. Results are mean ± SD from 3 independent experiments. Inner panel shows expression of DN β-catenin protein. β-actin was used as loading control. (G) In vivo lung colony–formation assay. β-cat–siRNA-WM3248-NIC-GFP or H1UG-WM3248-NIC-GFP cells were injected intravenously into mice. After 12 weeks, lung samples were harvested and analyzed. Tumor colonies formed on the lung surface were macroscopically counted under a dissection microscope. Data are mean ± SD.

Similar articles

Cited by

References

    1. Artavanis-Tsakonas S, Rand MD, Lake RJ. Notch signaling: cell fate control and signal integration in development. Science. 1999;284:770–776. - PubMed
    1. Davis RL, Turner DL. Vertebrate hairy and enhancer of split related proteins: transcriptional repressors regulating cellular differentiation and embryonic patterning. Oncogene. 2001;20:8342–8357. - PubMed
    1. Iso T, Kedes L, Hamamori Y. HES and HERP families: multiple effectors of the notch signaling pathway. J. Cell. Physiol. 2003;194:237–255. - PubMed
    1. Reizis B, Leder P. Direct induction of T lymphocyte-specific gene expression by the mammalian notch signaling pathway. Genes Dev. 2002;16:295–300. - PMC - PubMed
    1. Rangarajan A, et al. Notch signaling is a direct determinant of keratinocyte growth arrest and entry into differentiation. EMBO J. 2001;20:3427–3436. - PMC - PubMed

Publication types

MeSH terms