Immunotherapy using unconjugated CD19 monoclonal antibodies in animal models for B lymphocyte malignancies and autoimmune disease
- PMID: 16217038
- PMCID: PMC1257712
- DOI: 10.1073/pnas.0505539102
Immunotherapy using unconjugated CD19 monoclonal antibodies in animal models for B lymphocyte malignancies and autoimmune disease
Abstract
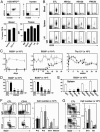
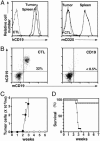
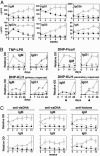
Immunotherapy with unconjugated CD20 monoclonal antibodies has proven effective for treating non-Hodgkin's lymphoma and autoimmune disease. CD20 immunotherapy depletes mature B cells but does not effectively deplete pre-B or immature B cells, some B cell subpopulations, antibody-producing cells, or their malignant counterparts. Because CD19 is expressed earlier during B cell development, a therapeutic strategy for the treatment of early lymphoblastic leukemias/lymphomas was developed by using CD19-specific monoclonal antibodies in a transgenic mouse expressing human CD19. Pre-B cells and their malignant counterparts were depleted as well as antibody- and autoantibody-producing cells. These results demonstrate clinical utility for the treatment of diverse B cell malignancies, autoimmune disease, and humoral transplant rejection.
Figures


Similar articles
-
CD19: a promising B cell target for rheumatoid arthritis.Nat Rev Rheumatol. 2009 Oct;5(10):572-7. doi: 10.1038/nrrheum.2009.184. Nat Rev Rheumatol. 2009. PMID: 19798033 Review.
-
Fcgamma receptor-dependent effector mechanisms regulate CD19 and CD20 antibody immunotherapies for B lymphocyte malignancies and autoimmunity.Springer Semin Immunopathol. 2006 Dec;28(4):351-64. doi: 10.1007/s00281-006-0057-9. Epub 2006 Nov 8. Springer Semin Immunopathol. 2006. PMID: 17091246
-
MEDI-551 Treatment Effectively Depletes B Cells and Reduces Serum Titers of Autoantibodies in Mice Transgenic for Sle1 and Human CD19.Arthritis Rheumatol. 2016 Apr;68(4):965-76. doi: 10.1002/art.39503. Arthritis Rheumatol. 2016. PMID: 26606525
-
The Tumor Microenvironment Regulates CD19 and CD20 Immunotherapy for Lymphoma.Cancer J. 2015 Jul-Aug;21(4):351-6. doi: 10.1097/PPO.0000000000000137. Cancer J. 2015. PMID: 26222089 Review.
-
Potent in vitro and in vivo activity of an Fc-engineered anti-CD19 monoclonal antibody against lymphoma and leukemia.Cancer Res. 2008 Oct 1;68(19):8049-57. doi: 10.1158/0008-5472.CAN-08-2268. Cancer Res. 2008. PMID: 18829563
Cited by
-
B-cell biology and related therapies in systemic lupus erythematosus.Rheum Dis Clin North Am. 2010 Feb;36(1):109-30, viii-ix. doi: 10.1016/j.rdc.2009.12.002. Rheum Dis Clin North Am. 2010. PMID: 20202594 Free PMC article.
-
Targeting B-cells mitigates autoimmune diabetes in NOD mice: what is plan B?Diabetes. 2009 Jul;58(7):1479-81. doi: 10.2337/db09-0497. Diabetes. 2009. PMID: 19564459 Free PMC article. No abstract available.
-
Murine models of systemic lupus erythematosus.J Biomed Biotechnol. 2011;2011:271694. doi: 10.1155/2011/271694. Epub 2011 Feb 14. J Biomed Biotechnol. 2011. PMID: 21403825 Free PMC article. Review.
-
A novel anti-CD19 monoclonal antibody (GBR 401) with high killing activity against B cell malignancies.J Hematol Oncol. 2014 Apr 14;7:33. doi: 10.1186/1756-8722-7-33. J Hematol Oncol. 2014. PMID: 24731302 Free PMC article.
-
BANK1 alters B cell responses and influences the interactions between B cells and induced T regulatory cells in mice with collagen-induced arthritis.Arthritis Res Ther. 2018 Jan 25;20(1):9. doi: 10.1186/s13075-017-1503-x. Arthritis Res Ther. 2018. PMID: 29370826 Free PMC article.
References
-
- Tuscano, J. M., Harris, G. & Tedder, T. F. (2003) Autoimmun. Rev. 2, 101-108. - PubMed
-
- Martin, F. & Chan, A. C. (2004) Immunity 20, 517-527. - PubMed
-
- Tedder, T. F. & Engel, P. (1994) Immunol. Today 15, 450-454. - PubMed
-
- McLaughlin, P., White, C. A., Grillo-Lopez, A. J. & Maloney, D. G. (1998) Oncology 12, 1763-1769. - PubMed
-
- McLaughlin, P., Grillo, L. A., Link, B. K., Levy, R., Czuczman, M. S., Williams, M. E., Heyman, M. R., Bence, B. I., White, C. A., Cabanillas, F., et al. (1998) J. Clin. Oncol. 16, 2825-2833. - PubMed
Publication types
MeSH terms
Substances
Grants and funding
LinkOut - more resources
Full Text Sources
Other Literature Sources
Medical
Molecular Biology Databases

