

Actin and agonist MHC-peptide complex-dependent T cell receptor microclusters as scaffolds for signaling
- PMID: 16216891
- PMCID: PMC1373686
- DOI: 10.1084/jem.20051182
Actin and agonist MHC-peptide complex-dependent T cell receptor microclusters as scaffolds for signaling
Abstract
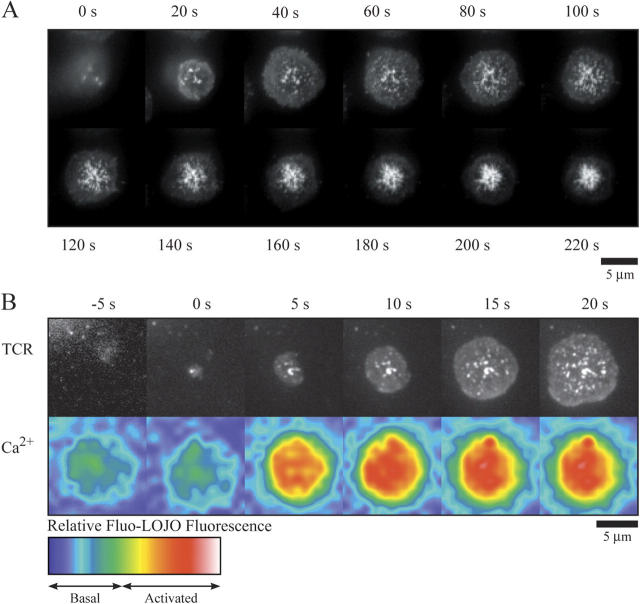
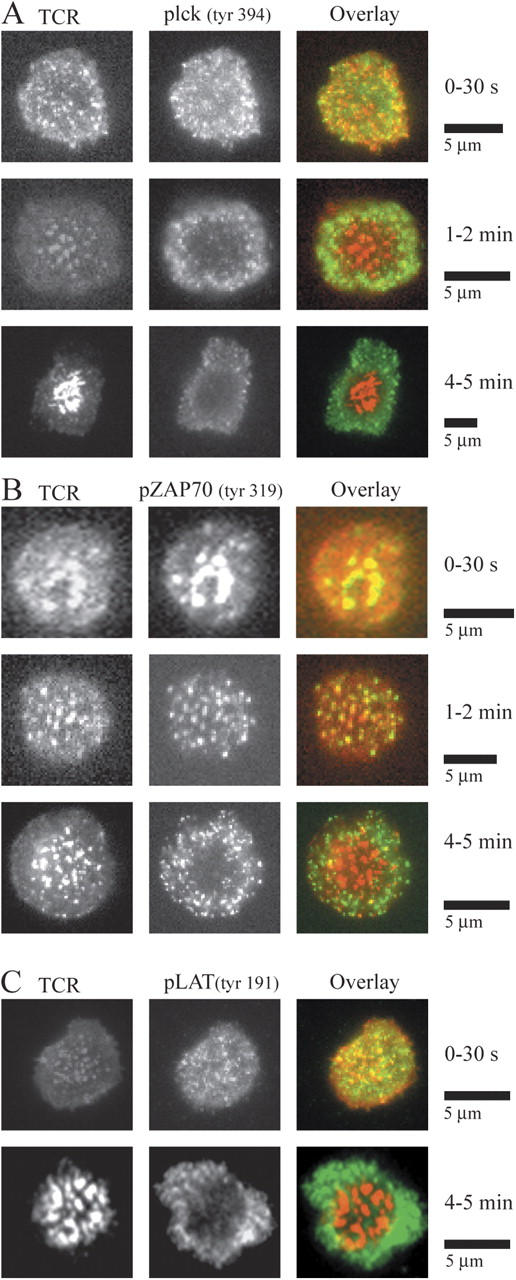
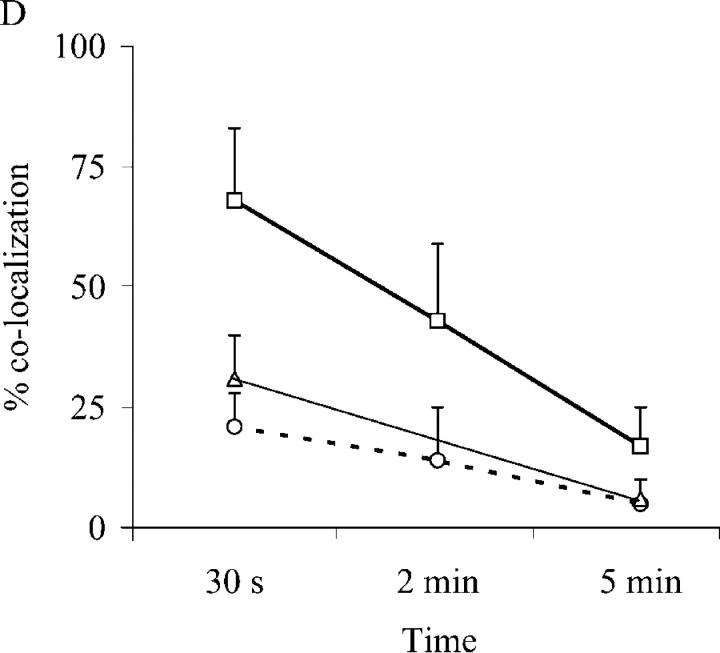
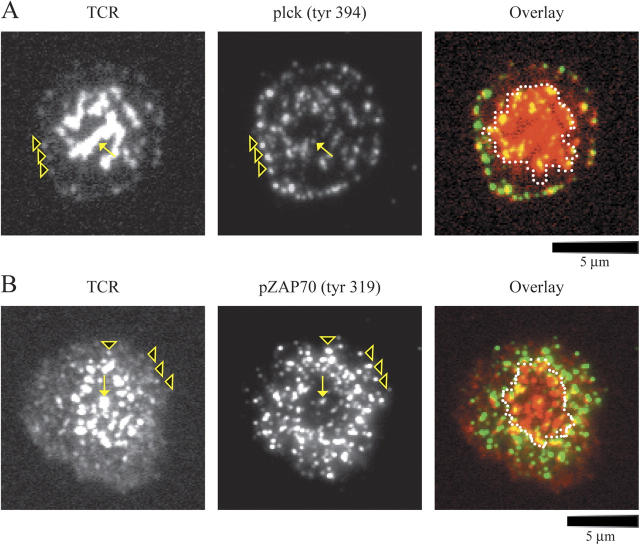
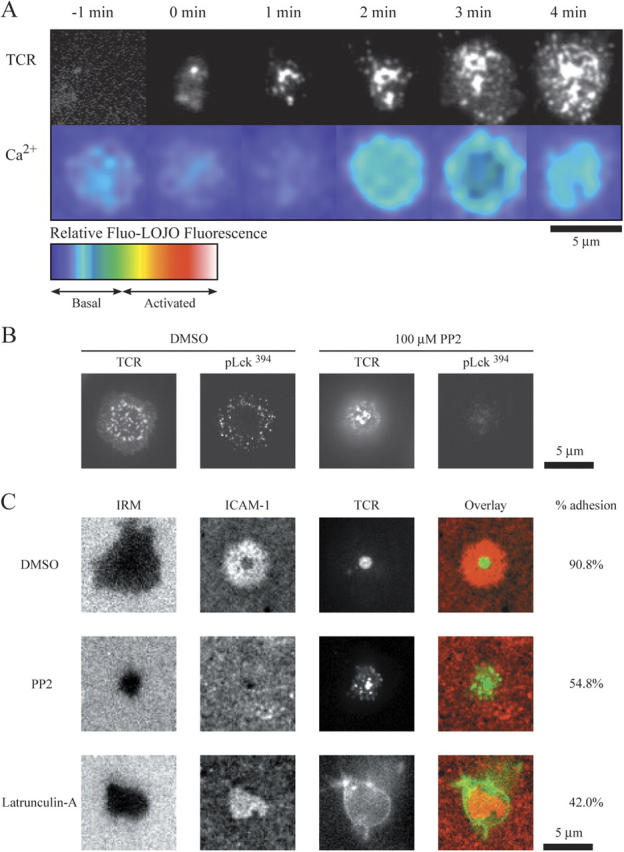
T cell receptor (TCR) microclusters form within seconds of T cell contact with supported planar bilayers containing intercellular adhesion molecule-1 and agonist major histocompatibility complex (MHC)-peptide complexes, and elevation of cytoplasmic Ca2+ is observed within seconds of the first detectable microclusters. At 0-30 s after contact, TCR microclusters are colocalized with activated forms of Lck, ZAP-70, and the linker for activation of T cells. By 2 min, activated kinases are reduced in the older central microclusters, but are abundant in younger peripheral microclusters. By 5 min, TCR in the central supramolecular activation cluster have reduced activated kinases, whereas faint peripheral TCR microclusters efficiently generated activated Lck and ZAP-70. TCR microcluster formation is resistant to inhibition by Src family kinase inhibitor PP2, but is abrogated by actin polymerization inhibitor latrunculin A. We propose that Src kinase-independent formation of TCR microclusters in response to agonist MHC-peptide provides an actin-dependent scaffold for signal amplification.
Figures
Similar articles
-
T cell receptor-proximal signals are sustained in peripheral microclusters and terminated in the central supramolecular activation cluster.Immunity. 2006 Jul;25(1):117-27. doi: 10.1016/j.immuni.2006.04.010. Immunity. 2006. PMID: 16860761 Free PMC article.
-
Signal initiation in T-cell receptor microclusters.Immunol Rev. 2008 Feb;221:90-106. doi: 10.1111/j.1600-065X.2008.00593.x. Immunol Rev. 2008. PMID: 18275477 Review.
-
Dynamic regulation of T-cell costimulation through TCR-CD28 microclusters.Immunol Rev. 2009 May;229(1):27-40. doi: 10.1111/j.1600-065X.2009.00779.x. Immunol Rev. 2009. PMID: 19426213 Review.
-
Newly generated T cell receptor microclusters initiate and sustain T cell activation by recruitment of Zap70 and SLP-76.Nat Immunol. 2005 Dec;6(12):1253-62. doi: 10.1038/ni1272. Epub 2005 Nov 6. Nat Immunol. 2005. PMID: 16273097
-
T cell activation at the immunological synapse: vesicles emerge for LATer signaling.Sci Signal. 2010 May 11;3(121):pe16. doi: 10.1126/scisignal.3121pe16. Sci Signal. 2010. PMID: 20460646 Review.
Cited by
-
The coreceptor CD4 is expressed in distinct nanoclusters and does not colocalize with T-cell receptor and active protein tyrosine kinase p56lck.Proc Natl Acad Sci U S A. 2015 Mar 31;112(13):E1604-13. doi: 10.1073/pnas.1503532112. Epub 2015 Mar 17. Proc Natl Acad Sci U S A. 2015. PMID: 25829544 Free PMC article.
-
Actin polymerization-dependent activation of Cas-L promotes immunological synapse stability.Immunol Cell Biol. 2016 Nov;94(10):981-993. doi: 10.1038/icb.2016.61. Epub 2016 Jun 30. Immunol Cell Biol. 2016. PMID: 27359298 Free PMC article.
-
T cell antigen receptor activation and actin cytoskeleton remodeling.Biochim Biophys Acta. 2014 Feb;1838(2):546-56. doi: 10.1016/j.bbamem.2013.05.004. Epub 2013 May 14. Biochim Biophys Acta. 2014. PMID: 23680625 Free PMC article. Review.
-
The lymphoid lineage-specific actin-uncapping protein Rltpr is essential for costimulation via CD28 and the development of regulatory T cells.Nat Immunol. 2013 Aug;14(8):858-66. doi: 10.1038/ni.2634. Epub 2013 Jun 23. Nat Immunol. 2013. PMID: 23793062
-
How membrane structures control T cell signaling.Front Immunol. 2012 Sep 21;3:291. doi: 10.3389/fimmu.2012.00291. eCollection 2012. Front Immunol. 2012. PMID: 23055999 Free PMC article.
References
-
- Krogsgaard, M., and M.M. Davis. 2005. How T cells “see” antigen. Nat. Immunol. 6:239–245. - PubMed
-
- Monks, C.R., B.A. Freiberg, H. Kupfer, N. Sciaky, and A. Kupfer. 1998. Three-dimensional segregation of supramolecular activation clusters in T cells. Nature. 395:82–86. - PubMed
-
- Bromley, S.K., W.R. Burack, K.G. Johnson, K. Somersalo, T.N. Sims, C. Sumen, M.M. Davis, A.S. Shaw, P.M. Allen, and M.L. Dustin. 2001. The immunological synapse. Annu. Rev. Immunol. 19:375–396. - PubMed
-
- Huppa, J.B., and M.M. Davis. 2003. T-cell-antigen recognition and the immunological synapse. Nat. Rev. Immunol. 3:973–983. - PubMed
-
- Grakoui, A., S.K. Bromley, C. Sumen, M.M. Davis, A.S. Shaw, P.M. Allen, and M.L. Dustin. 1999. The immunological synapse: a molecular machine controlling T cell activation. Science. 285:221–227. - PubMed
Publication types
MeSH terms
Substances
Grants and funding
LinkOut - more resources
Full Text Sources
Other Literature Sources
Molecular Biology Databases
Research Materials
Miscellaneous
