

Structural characterization of apomyoglobin self-associated species in aqueous buffer and urea solution
- PMID: 16214860
- PMCID: PMC1367028
- DOI: 10.1529/biophysj.105.070227
Structural characterization of apomyoglobin self-associated species in aqueous buffer and urea solution
Abstract
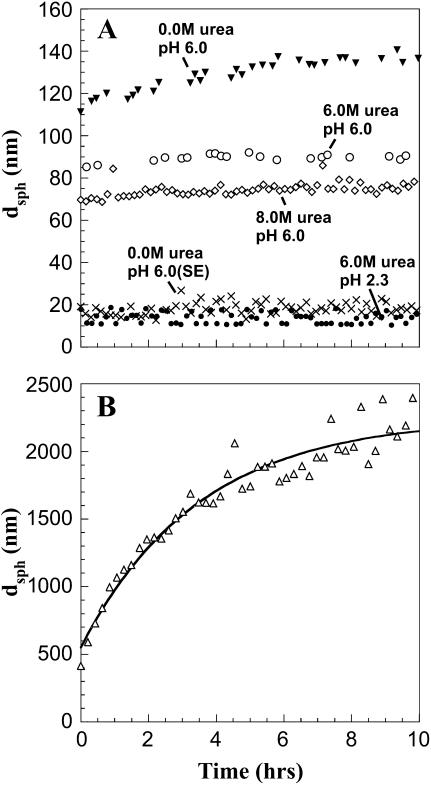
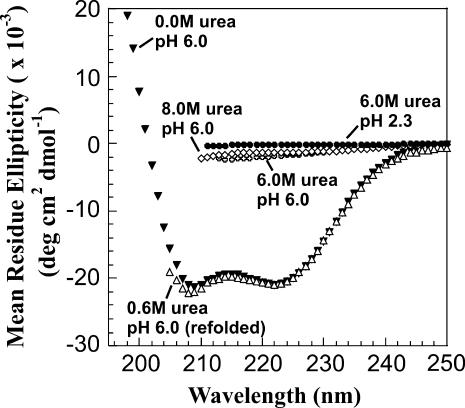
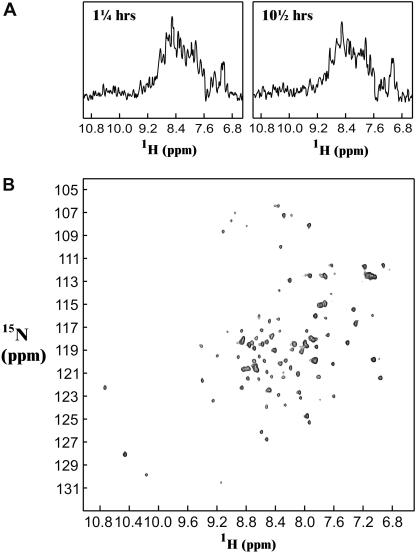
The biophysical characterization of nonfunctional protein aggregates at physiologically relevant temperatures is much needed to gain deeper insights into the kinetic and thermodynamic relationships between protein folding and misfolding. Dynamic and static laser light scattering have been employed for the detection and detailed characterization of apomyoglobin (apoMb) soluble aggregates populated at room temperature upon dissolving the purified protein in buffer at pH 6.0, both in the presence and absence of high concentrations of urea. Unlike the beta-sheet self-associated aggregates previously reported for this protein at high temperatures, the soluble aggregates detected here have either alpha-helical or random coil secondary structure, depending on solvent and solution conditions. Hydrodynamic diameters range from 80 to 130 nm, with semiflexible chain-like morphology. The combined use of low pH and high urea concentration leads to structural unfolding and complete elimination of the large aggregates. Even upon starting from this virtually monomeric unfolded state, however, protein refolding leads to the formation of severely self-associated species with native-like secondary structure. Under these conditions, kinetic apoMb refolding proceeds via two parallel routes: one leading to native monomer, and the other leading to a misfolded and heavily self-associated state bearing native-like secondary structure.
Figures
Similar articles
-
Evidence for a Shared Mechanism in the Formation of Urea-Induced Kinetic and Equilibrium Intermediates of Horse Apomyoglobin from Ultrarapid Mixing Experiments.PLoS One. 2015 Aug 5;10(8):e0134238. doi: 10.1371/journal.pone.0134238. eCollection 2015. PLoS One. 2015. PMID: 26244984 Free PMC article.
-
Effect of H helix destabilizing mutations on the kinetic and equilibrium folding of apomyoglobin.J Mol Biol. 1999 Jan 8;285(1):269-82. doi: 10.1006/jmbi.1998.2273. J Mol Biol. 1999. PMID: 9878405
-
Diffusive motions control the folding and unfolding kinetics of the apomyoglobin pH 4 molten globule intermediate.Biochemistry. 2007 Apr 10;46(14):4379-89. doi: 10.1021/bi602574x. Epub 2007 Mar 17. Biochemistry. 2007. PMID: 17367166
-
The folding process of apomyoglobin.Protein Pept Lett. 2005 Apr;12(3):229-34. doi: 10.2174/0929866053587174. Protein Pept Lett. 2005. PMID: 15777270 Review.
-
Misfolding and amyloid aggregation of apomyoglobin.Int J Mol Sci. 2013 Jul 9;14(7):14287-300. doi: 10.3390/ijms140714287. Int J Mol Sci. 2013. PMID: 23839096 Free PMC article. Review.
Cited by
-
High-resolution conformation and backbone dynamics of a soluble aggregate of apomyoglobin119.Biophys J. 2011 Feb 2;100(3):747-755. doi: 10.1016/j.bpj.2010.12.3722. Biophys J. 2011. PMID: 21281590 Free PMC article.
-
Critical Beginnings: Selective Tuning of Solubility and Structural Accuracy of Newly Synthesized Proteins by the Hsp70 Chaperone System.J Phys Chem B. 2023 May 11;127(18):3990-4014. doi: 10.1021/acs.jpcb.2c08485. Epub 2023 May 2. J Phys Chem B. 2023. PMID: 37130318 Free PMC article.
-
Delicate balance between functionally required flexibility and aggregation risk in a β-rich protein.Biochemistry. 2013 Dec 10;52(49):8843-54. doi: 10.1021/bi4013462. Epub 2013 Nov 25. Biochemistry. 2013. PMID: 24236614 Free PMC article.
-
Effect of hsp70 chaperone on the folding and misfolding of polypeptides modeling an elongating protein chain.J Mol Biol. 2006 Jan 27;355(4):809-20. doi: 10.1016/j.jmb.2005.10.029. Epub 2005 Nov 8. J Mol Biol. 2006. PMID: 16309705 Free PMC article.
-
Effects of urea and acetic acid on the heme axial ligation structure of ferric myoglobin at very acidic pH.Arch Biochem Biophys. 2009 Sep;489(1-2):68-75. doi: 10.1016/j.abb.2009.07.008. Epub 2009 Jul 19. Arch Biochem Biophys. 2009. PMID: 19622342 Free PMC article.
References
-
- Jaochim, C. L., and D. J. Selkoe. 1992. The seminal role of β-amyloid in the pathogenesis of Alzheimer disease. Alzheimer Dis. Assoc. Disord. 6:7–34. - PubMed
-
- Perutz, M. F. 1999. Glutamine repeats and neurodegenerative disease: molecular aspects. Trends Biochem. Sci. 24:56–63. - PubMed
-
- Scherzinger, E., and E. E. Wanker. 1997. Huntingtin-encoded polyglutamine expansions form amyloid-like protein. Cell. 90:549–558. - PubMed
-
- Hlodan, R., S. Craig, and R. H. Pain. 1991. Protein folding and its implications for the production of recombinant proteins. Biotechnol. Genet. Eng. Rev. 9:47–88. - PubMed
Publication types
MeSH terms
Substances
LinkOut - more resources
Full Text Sources
