Destructive effects of murine arthritogenic antibodies to type II collagen on cartilage explants in vitro
- PMID: 16207334
- PMCID: PMC1257420
- DOI: 10.1186/ar1766
Destructive effects of murine arthritogenic antibodies to type II collagen on cartilage explants in vitro
Abstract
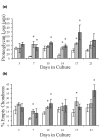
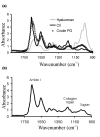
Certain monoclonal antibodies (mAbs) to type II collagen (CII) induce arthritis in vivo after passive transfer and have adverse effects on chondrocyte cultures and inhibit self assembly of collagen fibrils in vitro. We have examined whether such mAbs have detrimental effects on pre-existing cartilage. Bovine cartilage explants were cultured over 21 days in the presence of two arthritogenic mAbs to CII (CIIC1 or M2139), a non-arthritogenic mAb to CII (CIIF4) or a control mAb (GAD6). Penetration of cartilage by mAb was determined by immunofluorescence on frozen sections and correlated with changes to the extracellular matrix and chondrocytes by morphometric analysis of sections stained with toluidine blue. The effects of mAbs on matrix components were examined by Fourier transform infrared microspectroscopy (FTIRM). A possible role of Fc-binding was investigated using F(ab)2 from CIIC1. All three mAbs to CII penetrated the cartilage explants and CIIC1 and M2139, but not CIIF4, had adverse effects that included proteoglycan loss correlating with mAb penetration, the later development in cultures of an abnormal superficial cellular layer, and an increased proportion of empty chondrons. FTIRM showed depletion and denaturation of CII at the explant surface in the presence of CIIC1 or M2139, which paralleled proteoglycan loss. The effects of F(ab)2 were greater than those of intact CIIC1. Our results indicate that mAbs to CII can adversely affect preformed cartilage, and that the specific epitope on CII recognised by the mAb determines both arthritogenicity in vivo and adverse effects in vitro. We conclude that antibodies to CII can have pathogenic effects that are independent of inflammatory mediators or Fc-binding.
Figures


Similar articles
-
Arthritogenic anti-type II collagen antibodies are pathogenic for cartilage-derived chondrocytes independent of inflammatory cells.Arthritis Rheum. 2005 Jun;52(6):1897-906. doi: 10.1002/art.21097. Arthritis Rheum. 2005. PMID: 15934095
-
Specific antibody protection of the extracellular cartilage matrix against collagen antibody-induced damage.Arthritis Rheum. 2010 Nov;62(11):3374-84. doi: 10.1002/art.27671. Arthritis Rheum. 2010. PMID: 20662051
-
Arthritogenic antibodies specific for a major type II collagen triple-helical epitope bind and destabilize cartilage independent of inflammation.Arthritis Rheum. 2008 Jan;58(1):184-96. doi: 10.1002/art.23049. Arthritis Rheum. 2008. PMID: 18163493
-
Pathogenic antibody recognition of cartilage.Cell Tissue Res. 2010 Jan;339(1):213-20. doi: 10.1007/s00441-009-0816-8. Epub 2009 Jun 9. Cell Tissue Res. 2010. PMID: 19506910 Review.
-
Antibodies to citrullinated proteins: molecular interactions and arthritogenicity.Immunol Rev. 2010 Jan;233(1):9-33. doi: 10.1111/j.0105-2896.2009.00853.x. Immunol Rev. 2010. PMID: 20192990 Review.
Cited by
-
Antibody-induced arthritis: disease mechanisms and genes involved at the effector phase of arthritis.Arthritis Res Ther. 2006;8(6):223. doi: 10.1186/ar2089. Arthritis Res Ther. 2006. PMID: 17254316 Free PMC article. Review.
-
Evidence of altered biochemical composition in the hearts of adult intrauterine growth-restricted rats.Eur J Nutr. 2013 Mar;52(2):749-58. doi: 10.1007/s00394-012-0381-x. Epub 2012 May 29. Eur J Nutr. 2013. PMID: 22645107
-
K/BxN Serum-Transfer Arthritis as a Model for Human Inflammatory Arthritis.Front Immunol. 2016 Jun 2;7:213. doi: 10.3389/fimmu.2016.00213. eCollection 2016. Front Immunol. 2016. PMID: 27313578 Free PMC article. Review.
-
Dietary Conjugated Linoleic Acid-c9t11 Prevents Collagen-Induced Arthritis, Whereas Conjugated Linoleic Acid-t10c12 Increases Arthritic Severity.Lipids. 2017 Apr;52(4):303-314. doi: 10.1007/s11745-017-4241-6. Epub 2017 Mar 15. Lipids. 2017. PMID: 28299528
-
B Cell in Autoimmune Diseases.Scientifica (Cairo). 2012;2012:215308. doi: 10.6064/2012/215308. Scientifica (Cairo). 2012. PMID: 23807906 Free PMC article.
References
-
- Ronnelid J, Lysholm J, Engstrom-Laurent A, Klareskog L, Heyman B. Local anti-type II collagen antibody production in rheumatoid arthritis synovial fluid. Evidence for an HLA-DR4-restricted IgG response. Arthritis Rheum. 1994;37:1023–1029. - PubMed
Publication types
MeSH terms
Substances
LinkOut - more resources
Full Text Sources

