

MLL associates specifically with a subset of transcriptionally active target genes
- PMID: 16199523
- PMCID: PMC1253553
- DOI: 10.1073/pnas.0503630102
MLL associates specifically with a subset of transcriptionally active target genes
Abstract
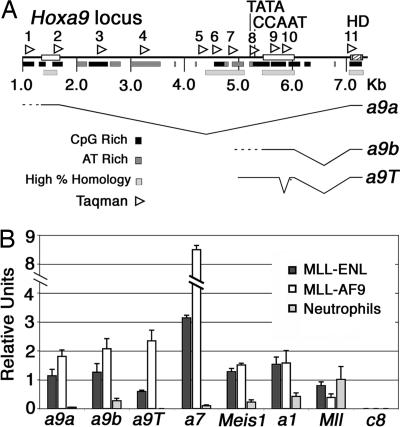
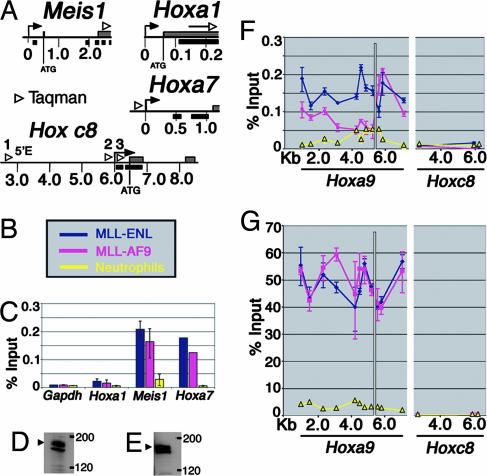
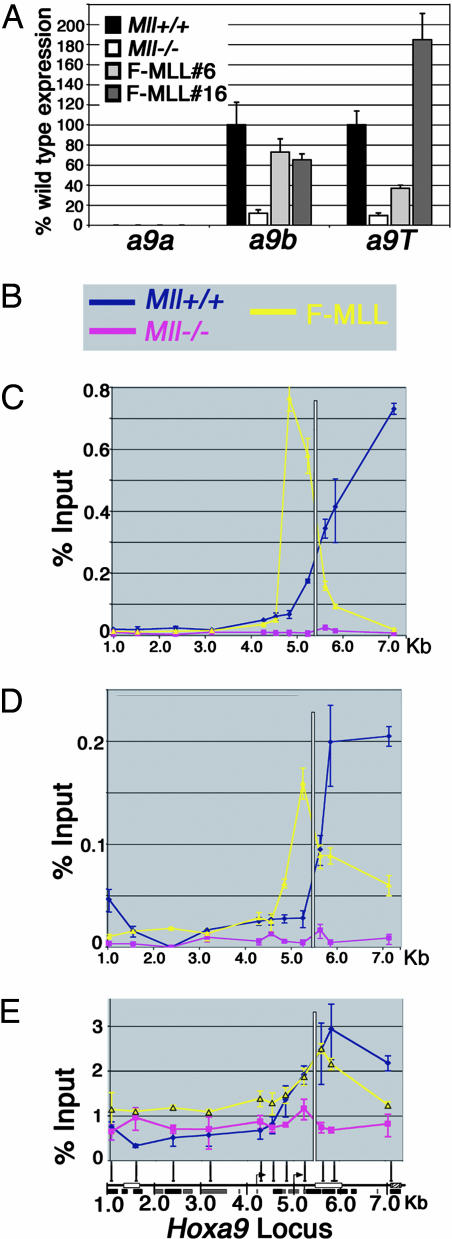
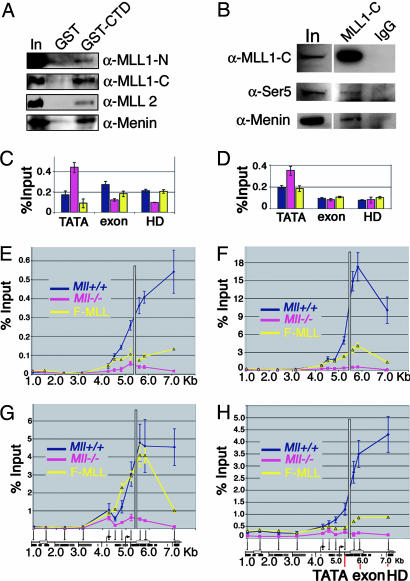
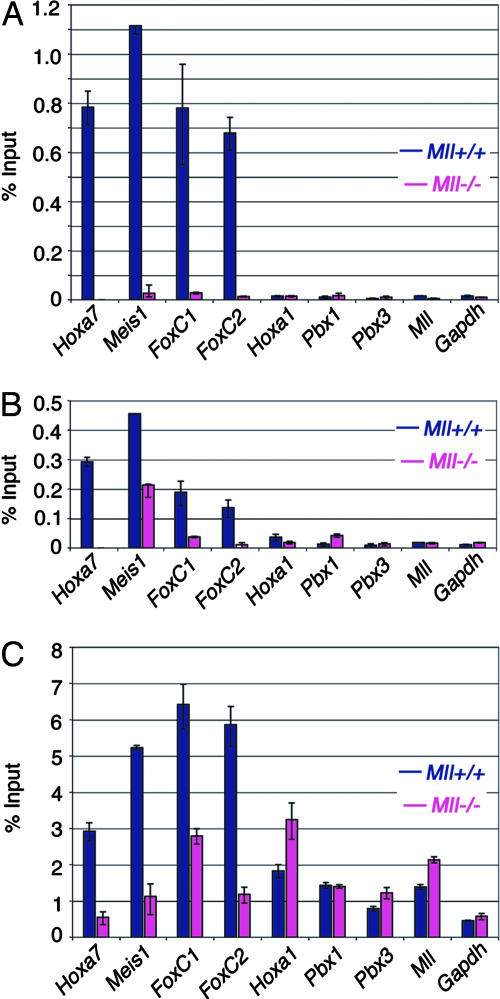
MLL (mixed-lineage leukemia) is a histone H3 Lys-4 specific methyltransferase that is a positive regulator of Hox expression. MLL rearrangements and amplification are common in acute lymphoid and myeloid leukemias and myelodysplastic disorders and are associated with abnormal up-regulation of Hox gene expression. Although MLL is expressed throughout hematopoiesis, Hox gene expression is sharply down-regulated during differentiation, suggesting that either the activity of MLL or its association with target promoters must be regulated. Here we show that MLL associates with actively transcribed genes but does not remain bound after transcriptional down-regulation. Surprisingly, MLL is associated not only with promoter regions but also is distributed across the entire coding regions of genes. MLL interacts with RNA polymerase II (pol II) and colocalizes with RNA pol II at a subset of actively transcribed target in vivo. Loss of function Mll results in defects in RNA pol II distribution. Together the results suggest that an intimate association between MLL and RNA pol II occurs at MLL target genes in vivo that is required for normal initiation and/or transcriptional elongation.
Figures
Comment in
-
Chromatin control of gene expression: mixed-lineage leukemia methyltransferase SETs the stage for transcription.Proc Natl Acad Sci U S A. 2005 Oct 11;102(41):14481-2. doi: 10.1073/pnas.0507401102. Epub 2005 Oct 3. Proc Natl Acad Sci U S A. 2005. PMID: 16203969 Free PMC article. No abstract available.
Similar articles
-
Misguided transcriptional elongation causes mixed lineage leukemia.PLoS Biol. 2009 Nov;7(11):e1000249. doi: 10.1371/journal.pbio.1000249. Epub 2009 Nov 24. PLoS Biol. 2009. PMID: 19956800 Free PMC article.
-
Global analysis of H3K4 methylation defines MLL family member targets and points to a role for MLL1-mediated H3K4 methylation in the regulation of transcriptional initiation by RNA polymerase II.Mol Cell Biol. 2009 Nov;29(22):6074-85. doi: 10.1128/MCB.00924-09. Epub 2009 Aug 24. Mol Cell Biol. 2009. PMID: 19703992 Free PMC article.
-
The molecular biology of mixed lineage leukemia.Haematologica. 2009 Jul;94(7):984-93. doi: 10.3324/haematol.2008.002436. Epub 2009 Jun 16. Haematologica. 2009. PMID: 19535349 Free PMC article. Review.
-
Epigenetic dysregulation of leukaemic HOX code in MLL-rearranged leukaemia mouse model.J Pathol. 2014 Jan;232(1):65-74. doi: 10.1002/path.4279. J Pathol. 2014. PMID: 24122813
-
Leukemogenesis via aberrant self-renewal by the MLL/AEP-mediated transcriptional activation system.Cancer Sci. 2021 Oct;112(10):3935-3944. doi: 10.1111/cas.15054. Epub 2021 Aug 2. Cancer Sci. 2021. PMID: 34251718 Free PMC article. Review.
Cited by
-
Induction of the 5S RNP-Mdm2-p53 ribosomal stress pathway delays the initiation but fails to eradicate established murine acute myeloid leukemia.Leukemia. 2017 Jan;31(1):213-221. doi: 10.1038/leu.2016.159. Epub 2016 Jun 3. Leukemia. 2017. PMID: 27256803
-
Primary hyperparathyroidism.Nat Rev Dis Primers. 2016 May 19;2:16033. doi: 10.1038/nrdp.2016.33. Nat Rev Dis Primers. 2016. PMID: 27194212 Free PMC article. Review.
-
Epigenetic control of gene expression in leukemogenesis: Cooperation between wild type MLL and MLL fusion proteins.Mol Cell Oncol. 2014 Oct 29;1(2):e955330. doi: 10.1080/23723548.2014.955330. eCollection 2014 Apr-Jun. Mol Cell Oncol. 2014. PMID: 27308325 Free PMC article. Review.
-
Profile of histone lysine methylation across transcribed mammalian chromatin.Mol Cell Biol. 2006 Dec;26(24):9185-95. doi: 10.1128/MCB.01529-06. Epub 2006 Oct 9. Mol Cell Biol. 2006. PMID: 17030614 Free PMC article.
-
Beta-catenin hits chromatin: regulation of Wnt target gene activation.Nat Rev Mol Cell Biol. 2009 Apr;10(4):276-86. doi: 10.1038/nrm2654. Nat Rev Mol Cell Biol. 2009. PMID: 19305417 Review.
References
-
- Pineault, N., Helgason, C. D., Lawrence, H. J. & Humphries, R. K. (2002) Exp. Hematol. 30, 49-57. - PubMed
-
- Ernst, P., Fisher, J. K., Avery, W., Wade, S., Foy, D. & Korsmeyer, S. J. (2004) Dev. Cell 6, 437-443. - PubMed
-
- Hess, J. L., Yu, B. D., Li, B., Hanson, R. & Korsmeyer, S. J. (1997) Blood 90, 1799-1806. - PubMed
-
- Yagi, H., Deguchi, K., Aono, A., Tani, Y., Kishimoto, T. & Komori, T. (1998) Blood 92, 108-117. - PubMed
-
- Yu, B. D., Hess, J. L., Horning, S. E., Brown, G. A. & Korsmeyer, S. J. (1995) Nature 378, 505-508. - PubMed
Publication types
MeSH terms
Substances
LinkOut - more resources
Full Text Sources
Other Literature Sources
