. 2005 Oct;79(20):12692-702.
doi: 10.1128/JVI.79.20.12692-12702.2005.

Heparan sulfate proteoglycans mediate attachment and entry of human T-cell leukemia virus type 1 virions into CD4+ T cells

Affiliations

Heparan sulfate proteoglycans mediate attachment and entry of human T-cell leukemia virus type 1 virions into CD4+ T cells

Kathryn S Jones et al. J Virol. 2005 Oct.

Abstract

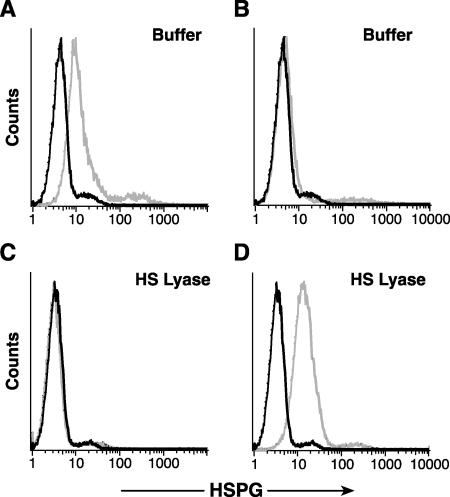
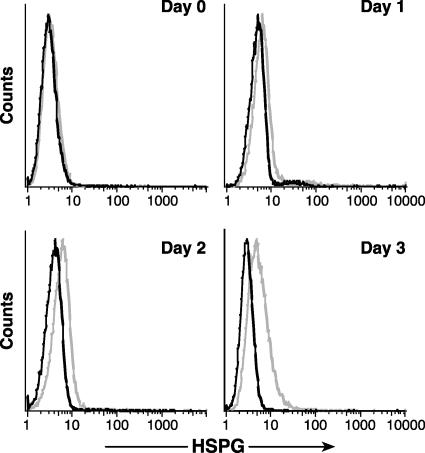
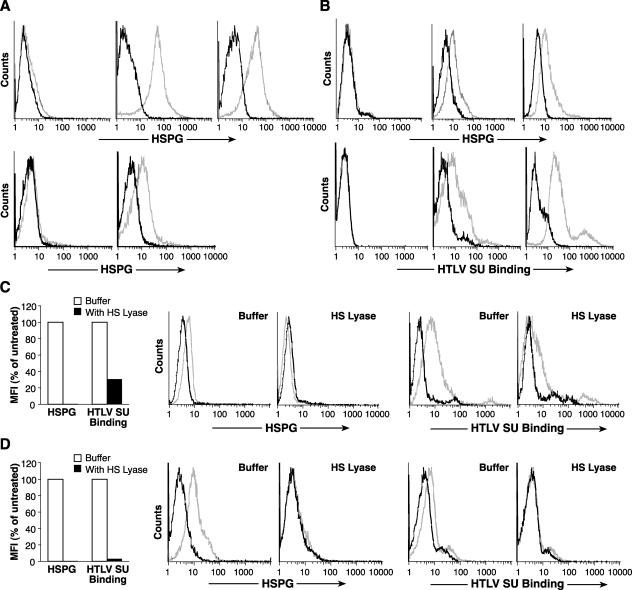
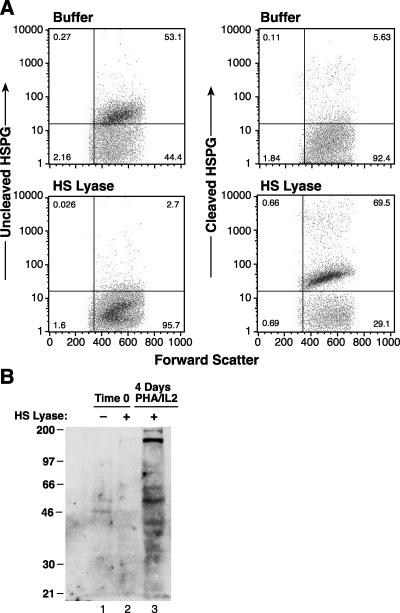
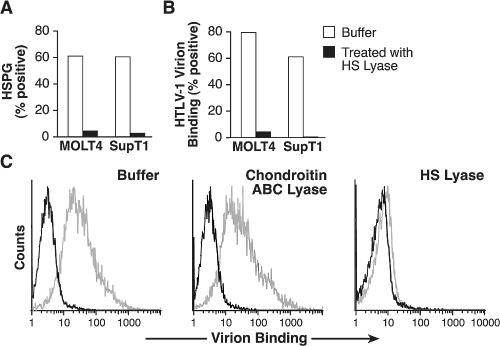
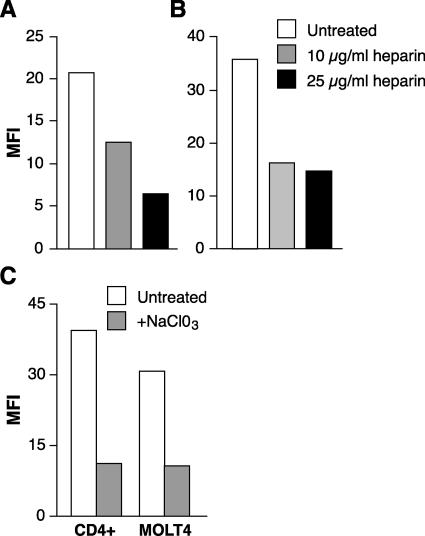
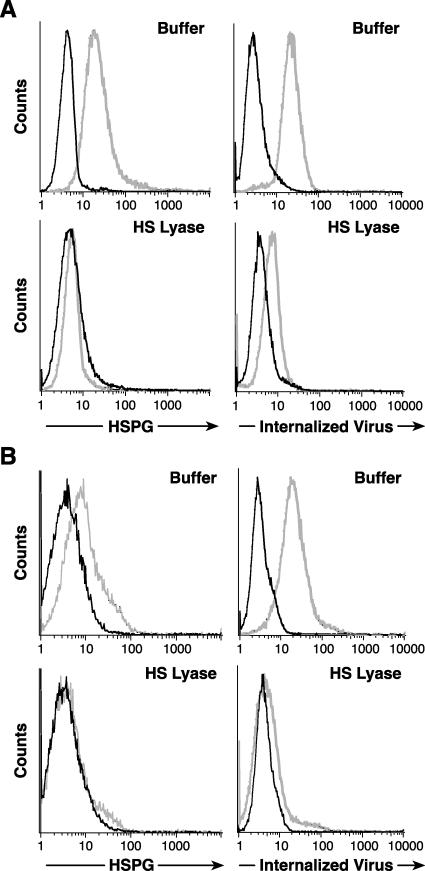
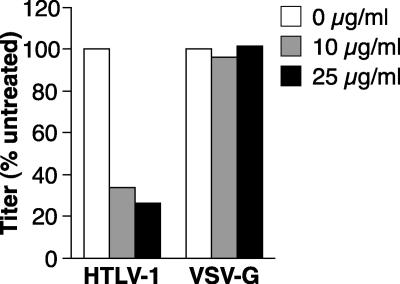
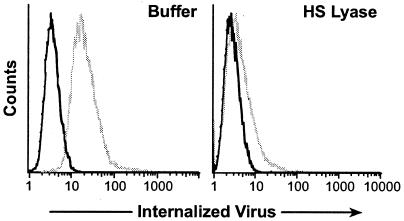
Heparan sulfate proteoglycans (HSPGs) are used by a number of viruses to facilitate entry into host cells. For the retrovirus human T-cell leukemia virus type 1 (HTLV-1), it has recently been reported that HSPGs are critical for efficient binding of soluble HTLV-1 SU and the entry of HTLV pseudotyped viruses into non-T cells. However, the primary in vivo targets of HTLV-1, CD4(+) T cells, have been reported to express low or undetectable levels of HSPGs. For this study, we reexamined the expression of HSPGs in CD4(+) T cells and examined their role in HTLV-1 attachment and entry. We observed that while quiescent primary CD4(+) T cells do not express detectable levels of HSPGs, HSPGs are expressed on primary CD4(+) T cells following immune activation. Enzymatic modification of HSPGs on the surfaces of either established CD4(+) T-cell lines or primary CD4(+) T cells dramatically reduced the binding of both soluble HTLV-1 SU and HTLV-1 virions. HSPGs also affected the efficiency of HTLV-1 entry, since blocking the interaction with HSPGs markedly reduced both the internalization of HTLV-1 virions and the titer of HTLV-1 pseudotyped viral infection in CD4(+) T cells. Thus, HSPGs play a critical role in the binding and entry of HTLV-1 into CD4(+) T cells.


Figures

FIG. 1.
FIG. 1.
HSPGs are expressed on CD4+ T-cell lines. MOLT4 cells were washed, resuspended in HS lyase buffer, and incubated with (bottom panels) or without (top panels) 20 mU of HS lyase. Cells were stained with a monoclonal antibody specific for intact HSPGs (F58-10E4) (panels A and C) or with a monoclonal antibody specific for an epitope generated by the cleavage of HSPGs with HS lyase (F69-3G10) (panels B and D). The data shown are from a representative experiment out of 10 performed. Light lines, anti-HSPG antibody; dark lines, isotype control.
FIG. 2.
FIG. 2.
HSPGs are transiently expressed during CD4+ T-cell growth. MOLT4 cells were grown to confluence and analyzed by flow cytometry for the presence of HSPGs as described above. The remainder of the culture was split 1:10, harvested 1, 2, or 3 days later, and analyzed for HSPG expression. The data shown are from a representative experiment out of three performed. Light lines, anti-HSPG antibody; dark lines, isotype control.
FIG. 3.
FIG. 3.
Activation of primary CD4+ T cells induces cell surface HSPG expression. (A) Monocytes and CD4+ T cells were isolated from adult peripheral blood Leukopaks as described in Materials and Methods. Cells were assayed for the level of HSPG as described in the text, either immediately or after 18 h of activation. Panels: top left, unstimulated monocytes; top middle; monocytes 18 h after stimulation with GM-CSF; top right, monocytes 18 h after stimulation with LPS; bottom left, unstimulated CD4+ T cells; bottom right, CD4+ T cells 18 h after stimulation with PHA and IL-2. (B) CD4+ T cells were isolated from cord blood as described in Materials and Methods, and flow cytometry was performed either immediately (left) or 3 days after activation with anti-CD3/anti-CD28 antibody beads (middle) or PHA and IL-2 (right). Top, cell surface expression of HSPGs was determined using the F58-10E4 antibody; bottom, expression levels of HTLV SU binding proteins were determined using the soluble form of the HTLV-1 SU protein (HTSU-IgG) or, as a negative control, SUA-IgG. (C) MOLT4 cells were incubated with or without 20 mU of HS lyase, and the levels of HSPGs and HTLV SU binding were assayed as described above. For both samples, the amount of specific binding was determined by subtracting the MFI of control (isotype control or SUA-IgG) binding from the MFI of specific (F58-10E4 or HTSU-IgG) binding. The MFI shown is expressed as a percentage of the MFI of untreated cells. (D) CD4+ T cells, isolated from adult peripheral blood and activated for 2 days with PHA and IL-2, were incubated with or without 10 mU of HS lyase. The levels of HSPGs and HTLV SU binding were determined as described for panel C. For panels C and D, the data shown are from a representative experiment out of nine performed. Symbols for HSPG analysis: light lines, F58-10E4; dark lines, IgM isotype control. Symbols for HTLV SU binding: light lines, HTSU-IgG; dark lines, SUA-IgG.
FIG. 4.
FIG. 4.
Expression of HSPGs on the cell surfaces of CD4+ T cells. (A) CD4+ T cells isolated from cord blood lymphocytes were activated for 4 days with PHA and IL-2. The cells were then incubated either with (bottom panels) or without (top panels) 10 mU of HS lyase, and flow cytometry was performed as described in Materials and Methods. Left panels, staining with F58-10E4; right panels, staining with F69-3G10. The data shown are from a representative experiment out of five performed. (B) CD4+ T cells isolated from cord blood lymphocytes, either quiescent or 4 days after activation with PHA and IL-2, were treated with 10 mU of HS lyase. Cells were lysed, and proteins were separated by electrophoresis and subjected to Western blot analysis using the F69-3G10 antibody as described in Materials and Methods.
FIG. 5.
FIG. 5.
Binding of HTLV-1 virions to CD4+ T cells involves interaction with HSPGs. (A and B) SupT1 and MOLT4 cells incubated either with or without HS lyase. Some cells were assayed for the ability to bind F58-10E4, and the remainder were exposed to concentrated HTLV-1 virions, with the amount of virion binding determined as described in Materials and Methods. The percentage of cells positive for virion binding was determined by subtracting the amount of anti-SU antibody binding observed in the absence of virus from that observed in the cells exposed to the virions. (A) Binding of F58-10E4 antibody. (B) Binding of HTLV-1 virions. (C) Activated CD4+ T cells isolated from adult peripheral blood were incubated for 2 h at 37°C in either buffer alone (left) or with buffer containing 1 U of chondroitin ABC lyase (middle) or 10 mU of HS lyase (right). Cells were then exposed to HTLV-1 virions, and the amount of virion binding was determined as described for panel B. Dark lines, binding in the absence of virions; light lines, binding in the presence of virions. The data shown are from a representative experiment out of five (A and B) or three (C) performed.
FIG. 6.
FIG. 6.
Blocking HSPG interactions reduces HTLV-1 virion binding to T cells. Concentrated HTLV-1 virions were incubated for 30 min in the presence of 0, 10, or 25 μg/ml of soluble heparin and then incubated with SupT1 (A) or activated CD4+ T cells isolated from adult peripheral blood (B), and the amount of virion binding was determined as described in Materials and Methods. (C) MOLT4 cells and activated CD4+ T cells isolated from adult peripheral blood were cultured either in RPMI containing 30 mM sodium chlorate or in RPMI alone for 3 days. The cells were then analyzed for virus binding. The data shown are from a representative experiment out of five (A and B) or three (C) performed.
FIG. 7.
FIG. 7.
HSPGs enhance HTLV-1 Env-mediated entry into CD4+ T cells. (A) MOLT4 cells were incubated either with (bottom) or without (top) 20 mU of HS lyase as described in the legends to the previous figures. (Left) HSPG expression was determined as described above. Dark lines, isotype control; light lines, F58-10E4. (Right) The extent of internalization was determined 2 h after exposing the cells to HTLV-1 virions, as described in Materials and Methods. Dark lines, mouse IgG1 (isotype control); light lines, anti-HTLV MA (p19) antibody. Without HS lyase treatment, the MFI was 17.8, and 89% of the cells were positive for internalized virus. With HS lyase treatment, the MFI was 2.6, and 8.9% of the cells were positive. (B) CD4+ T cells were isolated from cord blood lymphocytes, activated for 3 days with anti-CD3/anti-CD28 antibody beads, and then treated with 10 mU of HS lyase (bottom) or left untreated (top). (Left) HSPG binding to F58-10E4 (light lines) or isotype control (dark lines). (Right) Binding of anti-MA (p19) antibody (light lines) or isotype control (dark lines). The data shown are from a representative experiment out of 14 performed.
FIG. 8.
FIG. 8.
Soluble heparin decreases titers of HTLV-1 pseudotyped viruses in CD4+ T cells. HTLV-1 or VSV-G pseudotyped virus particles were generated as described in Materials and Methods. The virus preparations were incubated in RPMI containing 0, 10, or 25 μg/ml of soluble heparin for 30 min. SupT1 cells were resuspended at 2 × 10⁵/ml in RPMI, and then 0.5 ml of cells was mixed with an equal volume of the pseudotyped virus in the presence or absence of heparin, as indicated. The cells were transduced by spinoculation and then harvested 4 days later, and the viral titers were determined as described in Materials and Methods.
FIG. 9.
FIG. 9.
Blocking HSPG interactions blocks cell-cell transmission of HTLV-1. Cord blood CD4+ T cells were activated for 4 days with anti-CD3/anti-CD28 antibody beads and then either treated with HS lyase or incubated in buffer alone. MT-2 cells were irradiated and then incubated for 30 min with 25 μg/ml of soluble heparin or left untreated, as described in Materials and Methods. The appropriate irradiated MT-2 cells (with heparin for the HS lyase-treated targets and without heparin for the untreated targets) were then exposed to the CD4+ target cells at a ratio of 2:1. To distinguish the target cells from the MT-2 cells, the cells were first stained with an antibody directed against a cell surface antigen (CD3) that is expressed at high levels on primary CD4+ T cells and at undetectable levels on MT-2 cells. The cells were then permeabilized and stained for the HTLV-1 MA (p19) protein. (Left) Untreated; (Right) treated with HS lyase and soluble heparin. Dark lines, staining with mouse IgG1 (isotype control); light lines, staining with anti-HTLV p19 antibody.

Similar articles

Cited by

References

    1. Altmeyer, R. 2004. Virus attachment and entry offer numerous targets for antiviral therapy. Curr. Pharm. Des. 10:3701-3712. - PubMed
    1. Argyris, E. G., E. Acheampong, G. Nunnari, M. Mukhtar, K. J. Williams, and R. J. Pomerantz. 2003. Human immunodeficiency virus type 1 enters primary human brain microvascular endothelial cells by a mechanism involving cell surface proteoglycans independent of lipid rafts. J. Virol. 77:12140-12151. - PMC - PubMed
    1. Barth, H., C. Schafer, M. I. Adah, F. Zhang, R. J. Linhardt, H. Toyoda, A. Kinoshita-Toyoda, T. Toida, T. H. Van Kuppevelt, E. Depla, F. Von Weizsacker, H. E. Blum, and T. F. Baumert. 2003. Cellular binding of hepatitis C virus envelope glycoprotein E2 requires cell surface heparan sulfate. J. Biol. Chem. 278:41003-41012. - PubMed
    1. Bernard, K. A., W. B. Klimstra, and R. E. Johnston. 2000. Mutations in the E2 glycoprotein of Venezuelan equine encephalitis virus confer heparan sulfate interaction, low morbidity, and rapid clearance from blood of mice. Virology 276:93-103. - PubMed
    1. Bernfield, M., M. Gotte, P. W. Park, O. Reizes, M. L. Fitzgerald, J. Lincecum, and M. Zako. 1999. Functions of cell surface heparan sulfate proteoglycans. Annu. Rev. Biochem. 68:729-777. - PubMed

Publication types

MeSH terms

Substances