. 2005 Oct;115(10):2702-15.
doi: 10.1172/JCI24970. Epub 2005 Sep 22.

Epithelial myosin light chain kinase-dependent barrier dysfunction mediates T cell activation-induced diarrhea in vivo

Affiliations

Epithelial myosin light chain kinase-dependent barrier dysfunction mediates T cell activation-induced diarrhea in vivo

Daniel R Clayburgh et al. J Clin Invest. 2005 Oct.

Abstract

Disruption of the intestinal epithelial barrier occurs in many intestinal diseases, but neither the mechanisms nor the contribution of barrier dysfunction to disease pathogenesis have been defined. We utilized a murine model of T cell-mediated acute diarrhea to investigate the role of the epithelial barrier in diarrheal disease. We show that epithelial barrier dysfunction is required for the development of diarrhea. This diarrhea is characterized by reversal of net water flux, from absorption to secretion; increased leak of serum protein into the intestinal lumen; and altered tight junction structure. Phosphorylation of epithelial myosin II regulatory light chain (MLC), which has been correlated with tight junction regulation in vitro, increased abruptly after T cell activation and coincided with the development of diarrhea. Genetic knockout of long myosin light chain kinase (MLCK) or treatment of wild-type mice with a highly specific peptide MLCK inhibitor prevented epithelial MLC phosphorylation, tight junction disruption, protein leak, and diarrhea following T cell activation. These data show that epithelial MLCK is essential for intestinal barrier dysfunction and that this barrier dysfunction is critical to pathogenesis of diarrheal disease. The data also indicate that inhibition of epithelial MLCK may be an effective non-immunosuppressive therapy for treatment of immune-mediated intestinal disease.


Figures

Figure 1
Figure 1
Anti-CD3 injection causes diarrhea associated with Th1 cytokine induction. (A) The weight-to-length ratio of the small intestine, an indicator of tissue edema and luminal fluid accumulation, was increased after anti-CD3 injection. The weight-to-length ratio peaked 2–3 hours after injection and returned to baseline within 5–6 hours after injection (n = 4 for each time point). (B) Mucosal IFN-γ (blue line) and TNF-α (red line) transcription increased markedly after anti-CD3 injection, but returned to levels only slightly higher than baseline by 5 hours after injection (n = 3 for each time point). (C) Examination of the serosa in control and anti-CD3-treated mice revealed classic signs of inflammation after anti-CD3 injection, including vasodilation, edema, and erythema (scale bar, 0.5 mm).
Figure 2
Figure 2
Anti-CD3–induced diarrhea is associated with edema and increased numbers of intraepithelial lymphocytes but not ulceration or epithelial apoptosis. (A) Macroscopic examination of the small intestinal mucosae 3 hours after anti-CD3 injection showed distortion of the normal mucosal folds by edema and luminal fluid accumulation. Notably, anti-CD3 injection did not result in mucosal ulceration or erosion (scale bar, 1 mm). (B) Microscopic examination of the small intestinal mucosae revealed mild villous thickening 3 hours after anti-CD3 injection. An increase in the number of intraepithelial lymphocytes (arrows) was also present (5.1 ± 0.2 intraepithelial lymphocytes per 100 epithelial cells in control tissue vs. 7.9 ± 0.3 intraepithelial lymphocytes per 100 epithelial cells 3 hours after anti-CD3 injection; P < 0.0001), but there was no apparent epithelial damage or ulceration (scale bar, 100 μm). (C) Closer examination of the crypts showed mitotic figures in both control and anti-CD3–treated jejunum, but apoptotic cells were rare both before and 3 hours after anti-CD3 treatment (scale bar, 10 μm). (D) Quantitative analysis of apoptotic epithelial cells revealed no significant increase in number 3 hours after anti-CD3 injection. (E) Immunoblots for caspase-3 in isolated small intestinal epithelial cells 3 hours after vehicle or anti-CD3 injection detected only the uncleaved (inactive) form of this protein, indicating minimal caspase-3 activation.
Figure 3
Figure 3
In vivo measurement of water movement and paracellular flux in anti-CD3–induced diarrhea. (A) An in vivo perfusion system was developed to measure water movement and paracellular flux in a segment of intestine with an intact neurovascular supply. Water movement was determined via changes in the concentration of ferrocyanide in the perfusate, while paracellular flux was measured by the movement of intravenously injected fluorescent-tagged BSA into the perfusate. (B) In control mice, water was absorbed. Consistent with the development of diarrhea, anti-CD3 treatment reversed net water flow, resulting in net secretion. These changes were prevented by injection of a TNF-neutralizing antibody (n = 4). (C) BSA flux into the lumen of a perfused segment of small intestine, a measurement of paracellular macromolecular flux, was increased 340% ± 35% after anti-CD3 injection. Treatment with TNF-neutralizing antibody prevented 59% ± 5% of this anti-CD3–induced increase in BSA flux (n = 4). (D) Net water secretion occurred in anti-CD3–treated CFTRΔF508 (ΔF508) mice or in wild-type mice perfused with 100 μM niflumic acid, indicating that Cl secretion via CFTR or Ca2+-activated chloride channels is not necessary for water secretion after T cell activation. Inhibition of Na+ absorption in control animals using either Na+-free perfusate or the NHE inhibitors HOE694 (200 μM) and S3226 (10 μM) resulted in decreased absorption but did not cause net secretion of water (n = 3). (E) Increased paracellular flux also occurred in anti-CD3–treated CFTRΔF508 mice or mice treated with niflumic acid but was not induced by perfusion with Na+-free perfusate or the NHE inhibitors HOE694 and S3226 without anti-CD3 treatment (n = 3).
Figure 4
Figure 4
Changes in tight junction morphology after anti-CD3 treatment. (A) Immunofluorescent localization of the tight junction proteins claudin-1, claudin-4, claudin-5, and JAM-A in the small intestinal epithelium of wild-type mice demonstrates the localization of these proteins to the tight junction before (left panels) and 3 hours after (right panels) anti-CD3 treatment. Claudin-1, claudin-4, and claudin-5 distributions were not affected by anti-CD3 treatment. However, JAM-A demonstrated limited redistribution to intracellular sites after anti-CD3 treatment. (B) ZO-1 distribution appeared unchanged in transverse sections, but when viewed in en face sections, ZO-1 adopted a thinner, more sinuous distribution in anti-CD3–treated tissue. (C) Occludin was localized to the tight junction in control tissue, but after anti-CD3 treatment, occludin was internalized into intracellular vesicles (arrows), visible in both transverse and en face sections. Scale bars in AC, 5 μm. (D) Detergent-insoluble subcellular fractions of jejunal epithelial cells were isolated on isopycnic sucrose gradients (black line). Protein concentration was determined for each fraction of gradients prepared from control (blue line) and anti-CD3–treated (red line) mice. A protein peak associated with the low-density, detergent-insoluble membrane fraction was present (bracket). The arrow designates the insoluble high-density pellet (fraction 24). These fractions were assessed by immunoblot. (E) Immunoblots for occludin in lysate (diluted), pellet, and low-density, detergent-insoluble membrane fractions showed loss of occludin from the detergent-insoluble membrane fraction after anti-CD3 treatment.
Figure 5
Figure 5
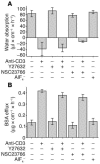
Small GTP-binding proteins are not involved in the development of anti-CD3–induced water secretion or increased paracellular flux. (A) Net water movement was measured in wild-type mice injected with 200 μg of anti-CD3 and perfused with 10 μM Y27632, 100 μM NSC23766, or 20 μM AlF4 as indicated. Neither the Rho kinase inhibitor Y27632 nor the Rac1 inhibitor NSC23766 was able to prevent net water secretion after anti-CD3 treatment, and perfusion with the GTPase activator AlF4 did not induce net water secretion (n = 3). (B) Similarly, measurement of paracellular flux in the same treatment groups shown in A demonstrated that neither Y27632 nor NSC23766 was able to prevent anti-CD3–induced increases in paracellular flux, while AlF4 perfusion did not stimulate increased flux (n = 3).
Figure 6
Figure 6
Systemic T cell activation increases intestinal epithelial MLC phosphorylation. (A) Electron micrographs of villous enterocytes from jejunum of control and anti-CD3–treated mice demonstrate disruption of the tight junction and marked perijunctional cytoskeletal condensation (arrow) after T cell activation (scale bar, 250 nm). (B) Phosphorylated MLC (red) in control intestinal villi was localized to the perijunctional actomyosin ring and demonstrates enhancement at cell junctions. Three hours after anti-CD3 treatment, MLC phosphorylation was markedly increased. Matched exposures are shown (scale bar, 5 μm). (C) Intestinal epithelial MLC phosphorylation, determined by immunoblot for phosphorylated and total MLC in isolated intestinal epithelial cells, revealed an increase in MLC phosphorylation 3 hours after anti-CD3 injection. This increase in MLC phosphorylation was largely prevented by the TNF-neutralizing antibody. (D) Immunoblots of phosphorylated MLC at several time points after anti-CD3 injection showed that epithelial MLC phosphorylation peaked 2–3 hours after anti-CD3 injection and returned to baseline levels within 5 hours after anti-CD3 injection. (E) Quantitative analysis of the blots showed that MLC phosphorylation (red line) increased and decreased in parallel with changes in intestinal weight-to-length ratio (blue line) induced by T cell activation (n = 3).
Figure 7
Figure 7
Mice lacking the 210-kDa MLCK demonstrate cytokine induction after anti-CD3 treatment but do not increase epithelial MLC phosphorylation. (A) Mucosal IFN-γ transcription was markedly increased 3 hours after anti-CD3 injection in both wild-type and MLCK–/– mice (n = 3). (B) Mucosal TNF-α transcription was markedly increased 3 hours after anti-CD3 injection in wild-type and MLCK–/– mice (n = 3). (C) Western blot analysis of MLC phosphorylation in isolated epithelial cells of wild-type and MLCK–/– mice 3 hours after anti-CD3 treatment showed a large increase in MLC phosphorylation in wild-type mice that did not occur in MLCK–/– mice.
Figure 8
Figure 8
210-kDa MLCK–/– mice are protected from anti-CD3–induced diarrhea. (A) Intestinal weight-to-length ratio did not increase in MLCK–/– mice 3 hours after anti-CD3 treatment, while wild-type mice showed a large increase in weight-to-length ratio (P = 0.52; n = 4) (B) Consistent with the lack of an increase in weight-to-length ratio, perfused segments of small intestine in MLCK–/– mice treated with anti-CD3 did not show significant changes in water movement relative to untreated MLCK–/– mice (P = 0.35; n = 4). (C) Paracellular permeability, indicated by BSA efflux, did not increase in MLCK–/– mice treated with anti-CD3 relative to untreated MLCK–/– mice (P = 0.12; n = 4). (D) Immunofluorescent detection of occludin in intestinal epithelia of MLCK–/– mice demonstrated that occludin remained confined to the tight junction 3 hours after anti-CD3 treatment, without any evidence of internalization (scale bar, 5 μm).
Figure 9
Figure 9
Treatment of intestinal epithelium with the MLCK inhibitor PIK. (A) The distribution of biotinylated stable PIK after perfusion of a segment of small intestine was detected using fluorescently tagged streptavidin (red). F-actin (green) and DNA (blue) are superimposed in the right panel for orientation. Perfused PIK was present in villous (V) and crypt (C) epithelia but was not seen within the lamina propria, muscularis mucosa, or submucosa (scale bars, 25 μm). (B) H&E-stained section of anti-CD3–treated intestine with and without PIK treatment showed no evidence of toxicity related to PIK treatment (scale bars, 100 μm). (C) Mucosal IFN-γ transcription was markedly increased 3 hours after anti-CD3 injection in both PIK-treated and untreated mice (n = 3). (D) Mucosal TNF-α transcription was markedly increased 3 hours after anti-CD3 injection in both PIK-treated and untreated mice (n = 3). (E) Western blot analysis of epithelial MLC phosphorylation revealed that the addition of 250 μM PIK to the luminal perfusate reduced baseline epithelial MLC phosphorylation and also prevented the large increase in MLC phosphorylation induced 3 hours after anti-CD3 injection.
Figure 10
Figure 10
Treatment with the MLCK inhibitor PIK prevents anti-CD3–mediated tight junction reorganization and diarrhea. (A) Immunofluorescence detection of occludin in the intestinal epithelium of mice treated with anti-CD3 and/or PIK showed that PIK prevents the internalization of occludin associated with anti-CD3 treatment (scale bar, 5 μm). (B) Increases in paracellular BSA efflux induced by anti-CD3 treatment were reduced by PIK perfusion in a dose-dependent manner (P = 0.015, 0 μM PIK with anti-CD3 vs. 80 μM PIK with anti-CD3; n = 4). (C) Treatment with 80 μM PIK resulted in the restoration of net water absorption in anti-CD3–treated mice (P = 0.006; n = 4).

Similar articles

Cited by

References

    1. Yuhan R, Koutsouris A, Savkovic SD, Hecht G. Enteropathogenic Escherichia coli-induced myosin light chain phosphorylation alters intestinal epithelial permeability. Gastroenterology. 1997;113:1873–1882. - PubMed
    1. Brown GR, et al. Tumor necrosis factor inhibitor ameliorates murine intestinal graft-versus-host disease. Gastroenterology. 1999;116:593–601. - PubMed
    1. Breslin NP, et al. Intestinal permeability is increased in a proportion of spouses of patients with Crohn’s disease. Am. J. Gastroenterol. 2001;96:2934–2938. - PubMed
    1. Wyatt J, Vogelsang H, Hubl W, Waldhoer T, Lochs H. Intestinal permeability and the prediction of relapse in Crohn’s disease. Lancet. 1993;341:1437–1439. - PubMed
    1. Yacyshyn BR, Meddings JB. CD45RO expression on circulating CD19+ B cells in Crohn’s disease correlates with intestinal permeability. Gastroenterology. 1995;108:132–137. - PubMed

Publication types

MeSH terms