. 2005 Sep 26;170(7):1067-78.
doi: 10.1083/jcb.200507087. Epub 2005 Sep 19.

Ganglioside-induced differentiation associated protein 1 is a regulator of the mitochondrial network: new implications for Charcot-Marie-Tooth disease

Affiliations

Ganglioside-induced differentiation associated protein 1 is a regulator of the mitochondrial network: new implications for Charcot-Marie-Tooth disease

Axel Niemann et al. J Cell Biol. .

Abstract

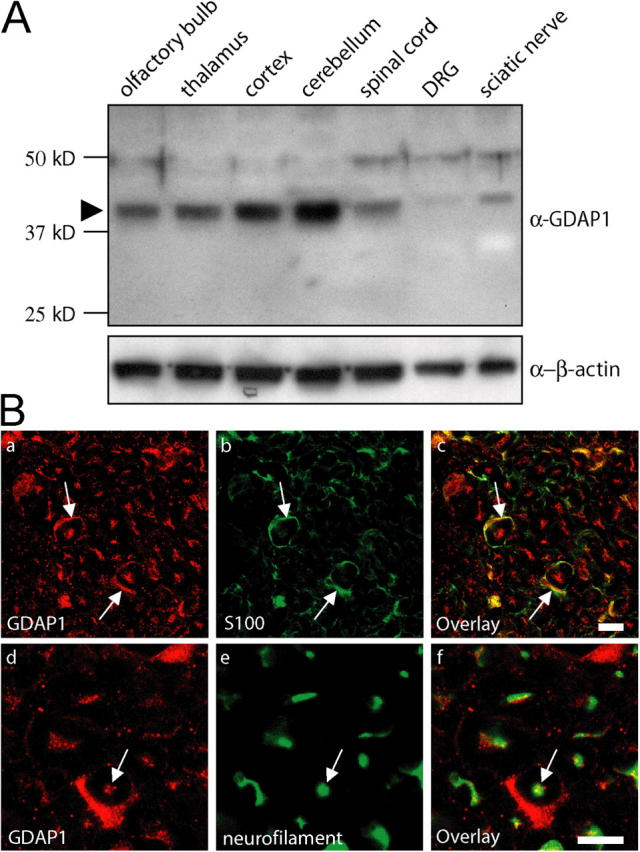
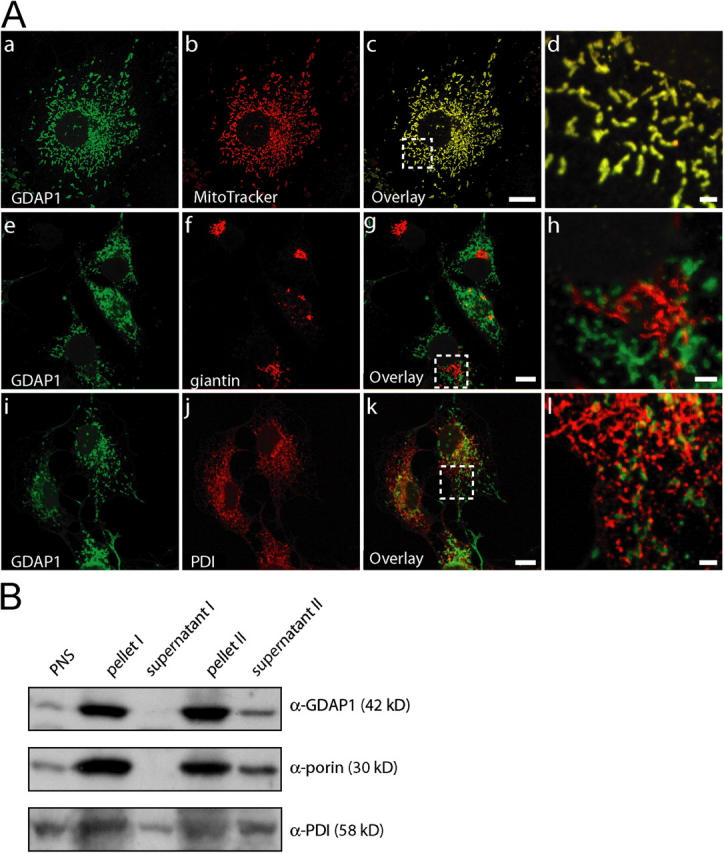
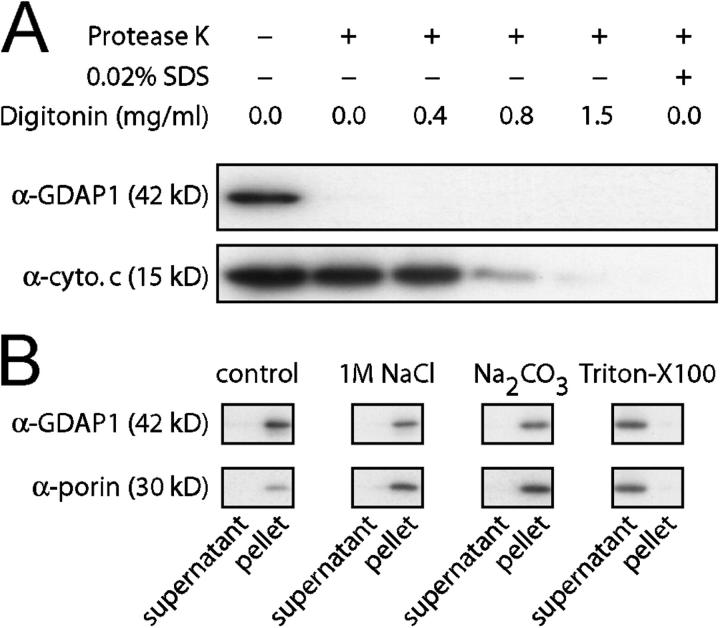
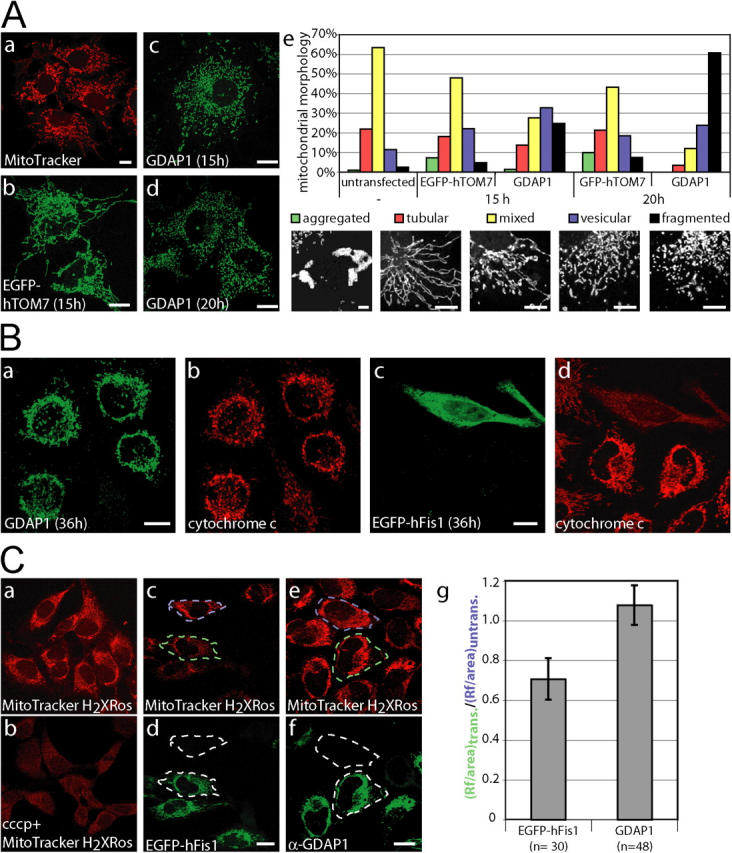
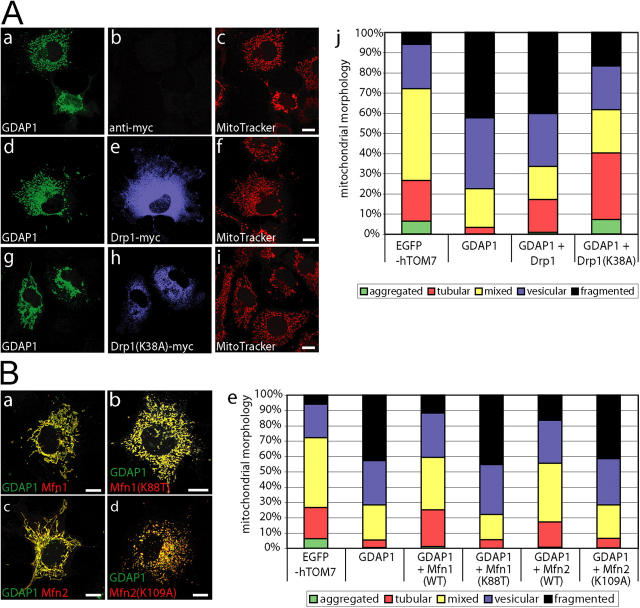
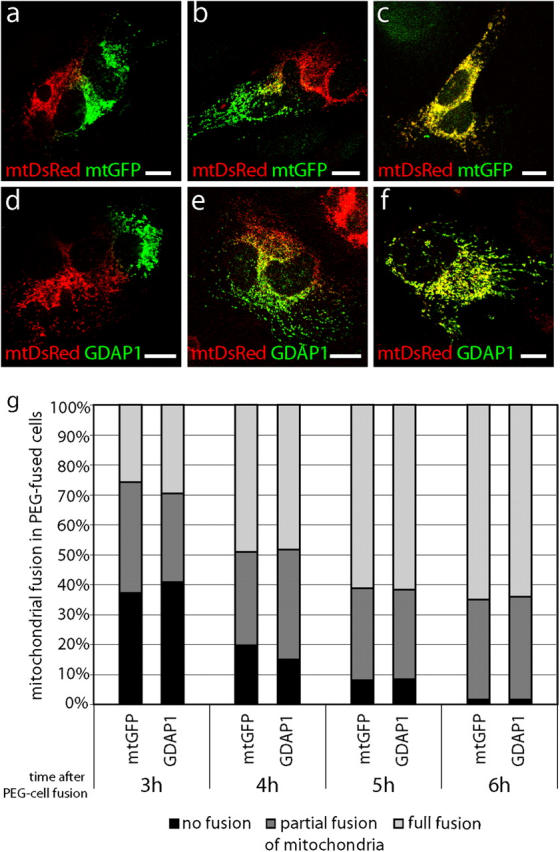
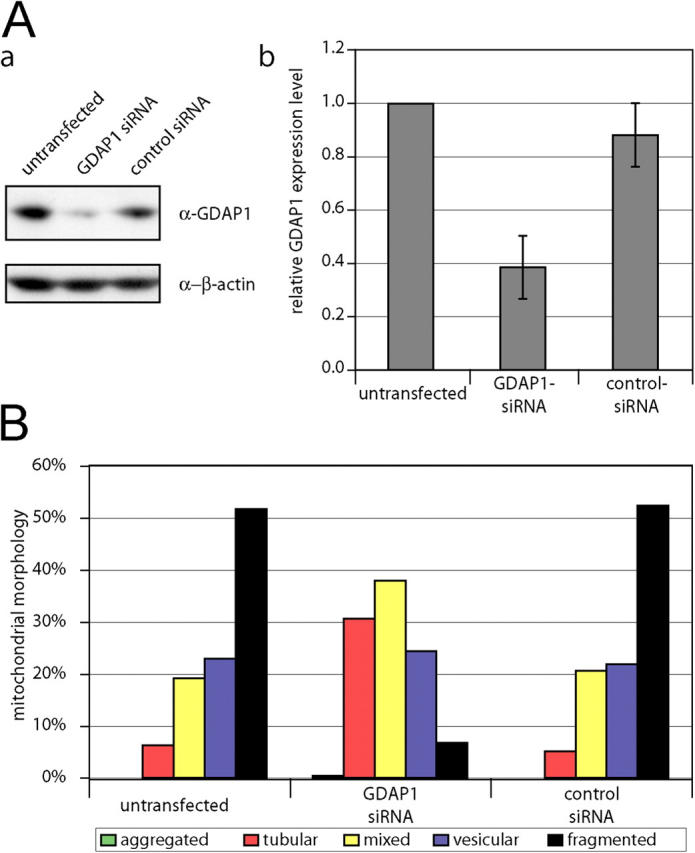
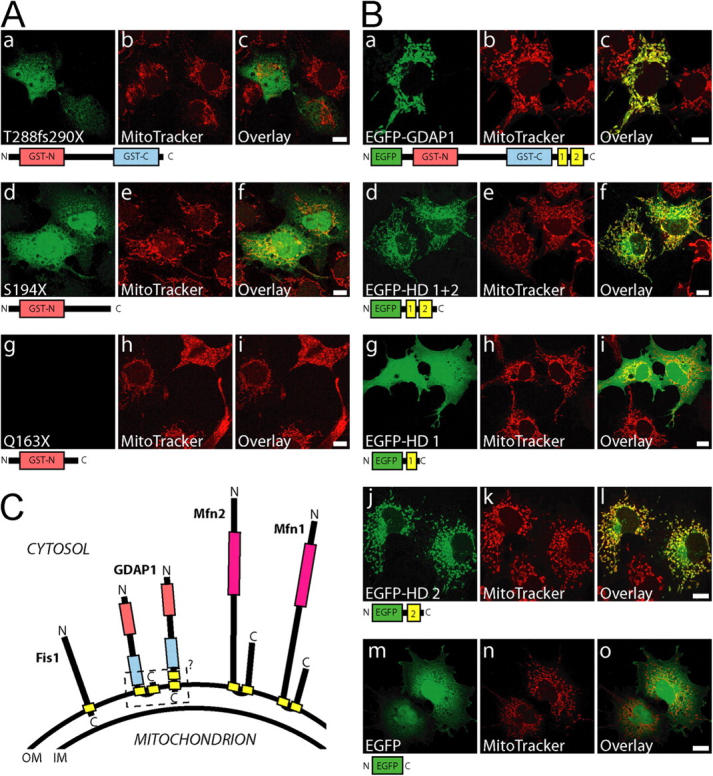
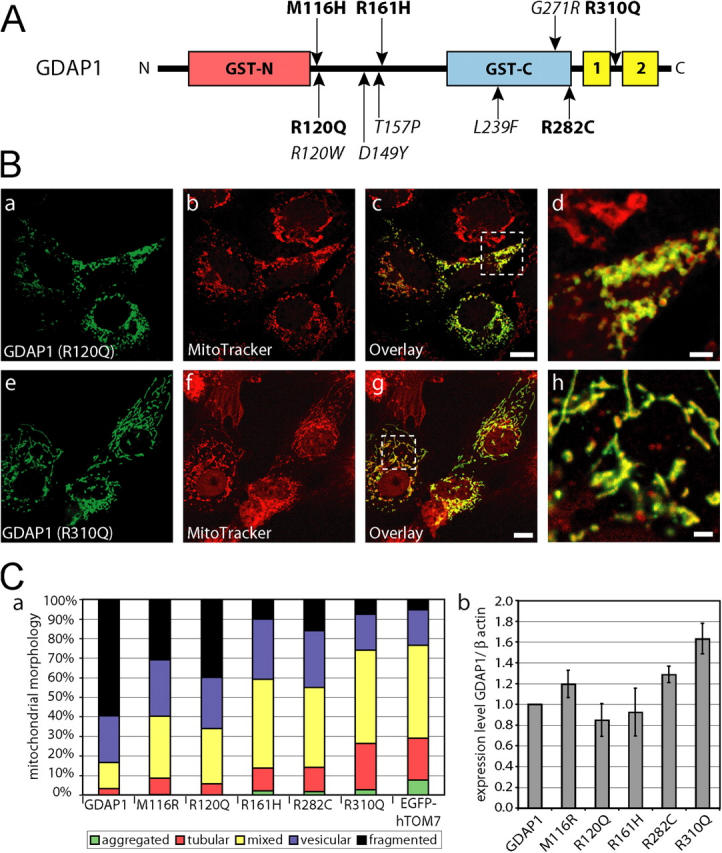
Mutations in GDAP1 lead to severe forms of the peripheral motor and sensory neuropathy, Charcot-Marie-Tooth disease (CMT), which is characterized by heterogeneous phenotypes, including pronounced axonal damage and demyelination. We show that neurons and Schwann cells express ganglioside-induced differentiation associated protein 1 (GDAP1), which suggest that both cell types may contribute to the mixed features of the disease. GDAP1 is located in the mitochondrial outer membrane and regulates the mitochondrial network. Overexpression of GDAP1 induces fragmentation of mitochondria without inducing apoptosis, affecting overall mitochondrial activity, or interfering with mitochondrial fusion. The mitochondrial fusion proteins, mitofusin 1 and 2 and Drp1(K38A), can counterbalance the GDAP1-dependent fission. GDAP1-specific knockdown by RNA interference results in a tubular mitochondrial morphology. GDAP1 truncations that are found in patients who have CMT are not targeted to mitochondria and have lost mitochondrial fragmentation activity. The latter activity also is reduced strongly for disease-associated GDAP1 point mutations. Our data indicate that an exquisitely tight control of mitochondrial dynamics, regulated by GDAP1, is crucial for the proper function of myelinated peripheral nerves.


Figures

Figure 1.
Figure 1.
GDAP1 protein is expressed in Schwann cells and neurons. (A) 15 μg of protein lysate from the indicated neuronal tissues was analyzed by Western blot. In all tissues tested, GDAP1 was detected at the predicted size of 41.5 kD (arrowhead). The expression was highest in central nervous system tissues. The additional weak bands at ∼48 kD and ∼75 kD were not detected with another GDAP1 antiserum, and thus, were considered to be unspecific. (B) GDAP1 expression on cryosections of rat sciatic nerve. The signal colocalizes on single-plane confocal pictures (0.5-μm sections) with the Schwann cell marker S100 (1B, a–c) and the neuronal marker neurofilament (1B, d–f). Bars, 10 μm.
Figure 2.
Figure 2.
GDAP1 is a mitochondrial protein. (A) Transfected COS-7 cells, 12 h after transfection with GDAP1 expression constructs. GDAP1 colocalizes with the mitochondrial marker MitoTracker Red (a–d), but not with the Golgi complex marker giantin (e–h) or the ER marker PDI (i–l) on single-plane confocal pictures (0.4-μm sections). Bars in c, g, and k, 10 μm; bars in d, h, and l, 2 μm. Boxes in c, g, and k indicate the magnified areas in d, h, and l. (B) Mitochondria from endogenously GDAP1-expressing N1E-115 cells were enriched in a differential centrifugation approach. 20 μg of protein yielded by the centrifugation steps were loaded per lane. The mitochondrial protein porin and GDAP1, but not the ER protein PDI, showed increased levels in the pellets.
Figure 3.
Figure 3.
GDAP1 is a transmembrane protein of the outer mitochondrial membrane. (A) A crude mitochondrial extract of transfected COS-7 cells was digested with proteinase K in the presence of increasing concentrations of digitonin. The digest was stopped after 30 min on ice with an excess of PMSF, and was analyzed by Western blot. The signal for GDAP1 was lost in the absence of digitonin. Cytochrome c was protected against the digest until the mitochondrial outer membrane was permeabilized with high concentrations of digitonin, or with SDS (bottom lane). (B) The mitochondrial pellet of transfected COS-7 cells was resuspended in buffer (control), in 1 M NaCl, in 0.1 M carbonate (pH 11), or in buffer with 0.1% Triton X-100, and centrifuged to separate the soluble protein supernatants from membranous pellets. GDAP1 and the known transmembrane protein porin are found in the supernatant only in the presence of detergent.
Figure 4.
Figure 4.
GDAP1 promotes mitochondrial fission. (A, a) Untransfected COS-7 cells display vesicular and tubular mitochondria, labeled with MitoTracker Red. (b) Transient transfection with the mitochondrial EGFP-fusion protein hTOM7 does not change this appearance. (c) The mitochondrial architecture is altered to a partially fragmented appearance 15 h after transfection with GDAP1. (d) After 20 h, most mitochondria are fragmented. (e) The morphologic results were quantified by classifying the appearance of mitochondria in GDAP1-expressing cells. Representative images for aggregated, tubular, mixed, vesicular, and fragmented mitochondrial appearance are shown. Bars: (a–d) 10 μm, (e) 5 μm. ∼500 transfected cells per condition from three independent experiments were counted. All changes are highly significant (probability > chi square > 0.001, comparing all conditions versus control transfected cells in a contingency analysis using JMP 5 [JMP Discovery]). (B) HeLa cells were transfected transiently with GDAP1 (a, b), or 0.5 μg plasmid DNA coding for the fission factor EGFP-hFis1 (c, d) and fixed 36 h after transfection. The expression of EGFP-Fis1 leads to a release of cytochrome c into the cytoplasm (c, d). Exclusive mitochondrial localization of cytochrome c was observed in cells expressing GDAP1 (a, b). (C) The mitochondrial uptake of the dye MitoTrackerH2XRos into HeLa cells is dependent on the activity of the mitochondria (a) and can be blocked with the protonophore cccp (b; 10 μM, 45 min) (b). HeLa cells were transfected with expression constructs for EGFP-hFis1 (0.25 μg; c, d) and GDAP1 (0.5 μg; e, f) and labeled with MitoTrackerH2Xros, 24 h after transfection. HeLa cells expressing EGFP-hFis1 display a weaker mitochondrial staining with MitoTrackerH2Xros (dashed green area) compared with untransfected cells (dashed blue box) (c, d). No difference between cells expressing GDAP1 and untransfected cells was found (compare dashed green and blue area) (e, f). The observation shown on the representative confocal images (a–f) was quantified using ImageJ (NIH) on 15 independent confocal pictures from three independent experiments (g; n, number of cells). Bars, (B and C) 10 μm.
Figure 5.
Figure 5.
GDAP1-induced fragmentation is counterbalanced by the activity of fusion-promoting factors. (A) COS-7 cells were cotransfected with 0.25 μg of a GDAP1 expression vector and 0.25 μg of an empty vector (a–c), a vector coding for Drp1 (d–f), or dominant-negative Drp1(K38A) (g–i). 17 h after transfection, cells were counterstained with MitoTracker Red. Fixed cells were probed with anti-GDAP1 and anti-myc antibodies. (B) In analogy to the fission-blocking approach with Drp1(K38A), cotransfections of GDAP1 were performed with the fusion-inducing Mfn1 (a) or Mfn2 (c), or with the activity-deficient mutants Mfn1(K88T) or Mfn2(K109A) (b, d). Representative confocal images (0.3-μm sections) from three independent experiments are shown. The results were quantified (A, j and B, e) to show the percentage of transfected cells that express both proteins and belong to different mitochondrial classifications (n > 500 cells per condition). Bars, 10 μm.
Figure 6.
Figure 6.
GDAP1 expression does not block mitochondrial fusion. HeLa cells that were transfected transiently with mtDsRed were coplated with HeLa cells, which were transfected transiently with mtGFP (a–c) or GDAP1 (d–f). Cells were fused with PEG and cultivated in the presence of cycloheximide. 3–6 h after PEG fusion, the cell hybrids were analyzed for fusion of the mitochondrial markers. Cell hybrids with no mitochondrial fusion (a, d), with partial mitochondrial fusion (b, e), and with full mitochondrial fusion (c, f) are depicted in single-plane confocal pictures. Cell hybrids were counted from three independent experiments (n > 120 hybrids per time point). The percentage of hybrids with the different degrees of mitochondrial fusion at the time points indicated is shown (g). Bars, 10 μm.
Figure 7.
Figure 7.
GDAP1 knock-down leads to elongation of mitochondria. Neuroblastoma N1E-115 cells were transfected with double-stranded small interfering RNA against GDAP1, with the scrambled control, or were left untransfected. (A, a) Equal amounts of cell lysates were separated and immunoblotted against GDAP1 and β-actin as loading control. (b) The relative expression levels of GDAP1 in correlation to the β-actin levels are represented as the mean of three independent transfections. (B) The influence of GDAP1 knock-down on the mitochondrial architecture was quantified by counting in blinded experiments. At least 750 cells per condition were counted from three independent experiments. Transfection with GDAP1-specific small interfering RNA leads to a significant increase in tubular mitochondria (probability > chi square > 0.0001), whereas the control transfection did not change the mitochondrial architecture (probability > chi square < 0.5).
Figure 8.
Figure 8.
The COOH terminus of GDAP1 bears the mitochondrial-targeting signal. (A) Transiently transfected COS-7 cells were counterstained with MitoTracker Red before fixation; this was followed by GDAP1-antibody staining. The frame shift mutation GDAP1(T288fs290X) (a–c) and the stop mutation GDAP1(S194X) (d–f) have lost mitochondrial targeting. The shortest truncation tested, GDAP1(Q163X), was not detectable (g–i). (B) EGFP was fused to the NH2 terminus of the GDAP1 full-length protein (a–c), or the COOH-terminal parts of GDAP1 coding for the hydrophobic domains (HD) (d–f), for the first hydrophobic domain (g–i) or the second hydrophobic domain only (j–l). EGFP alone is not appreciably found in mitochondria (m–o). All images represent single 0.3-μm sections. All bars, 10 μm. (C) Schematic representation of known mammalian tail-anchored proteins that regulate the mitochondrial morphology. All proteins expose the NH2 terminus with the predicted catalytic domains (pink box, GTPase domain; red box, GST-N; blue box, GST-C) toward the cytosol. Hydrophobic domains are in yellow. For GDAP1, the exact localization of the hydrophobic domain 1 and of the COOH terminus remains unsolved (dashed box). IM, inner membrane; OM, outer membrane.
Figure 9.
Figure 9.
Disease-related GDAP1 point mutations are impaired in fission activity. (A) Schematic representation of the GDAP1 protein with known CMT-associated point mutations indicated. Mutations examined are in bold. (B) Transfected COS-7 cells were counterstained with MitoTracker Red before fixation and were stained with GDAP1 antibodies. All tested point mutations colocalized with mitochondria. Representative confocal pictures of GDAP1(R120Q) (a–d) and GDAP1(R310Q) (e–h) are shown. Bars in c, g, 10 μm; bars in d, h, 2 μm. (C, a) The influence on the mitochondrial architecture was quantified for all point mutations. We counted at least 500 cells per point mutation that expressed GDAP1 or one of the point mutations tested. The cells were grouped into five mitochondrial classifications. All changes are highly significant (probability > chi square > 0.001, comparing all conditions versus GDAP1 [wild-type] transfected cells in a contingency analysis). The expression levels of the tested GDAP1 point mutations were comparable to the GDAP1 wild-type protein in transfected COS-7 cells (quantified as ratio of the anti-GDAP1/anti-β-actin signals in cell lysates of sister plates [b]).

Similar articles

Cited by

References

    1. Ammar, N., E. Nelis, L. Merlini, N. Barisic, R. Amouri, C. Ceuterick, J.J. Martin, V. Timmerman, F. Hentati, and P. De Jonghe. 2003. Identification of novel GDAP1 mutations causing autosomal recessive Charcot-Marie-Tooth disease. Neuromuscul. Disord. 13:720–728. - PubMed
    1. Azzedine, H., M. Ruberg, D. Ente, C. Gilardeau, S. Perie, B. Wechsler, A. Brice, E. LeGuern, and O. Dubourg. 2003. Variability of disease progression in a family with autosomal recessive CMT associated with a S194X and new R310Q mutation in the GDAP1 gene. Neuromuscul. Disord. 13:341–346. - PubMed
    1. Bach, D., S. Pich, F.X. Soriano, N. Vega, B. Baumgartner, J. Oriola, J.R. Daugaard, J. Lloberas, M. Camps, J.R. Zierath, et al. 2003. Mitofusin-2 determines mitochondrial network architecture and mitochondrial metabolism. A novel regulatory mechanism altered in obesity. J. Biol. Chem. 278:17190–17197. - PubMed
    1. Baxter, R.V., K. Ben Othmane, J.M. Rochelle, J.E. Stajich, C. Hulette, S. Dew-Knight, F. Hentati, M. Ben Hamida, S. Bel, J.E. Stenger, et al. 2002. Ganglioside-induced differentiation-associated protein-1 is mutant in Charcot-Marie-Tooth disease type 4A/8q21. Nat. Genet. 30:21–22. - PubMed
    1. Berger, P., E.E. Sirkowski, S.S. Scherer, and U. Suter. 2004. Expression analysis of the N-Myc downstream-regulated gene 1 indicates that myelinating Schwann cells are the primary disease target in hereditary motor and sensory neuropathy-Lom. Neurobiol. Dis. 17:290–299. - PubMed

Publication types

MeSH terms