

A biophysical model of the mitochondrial respiratory system and oxidative phosphorylation
- PMID: 16163394
- PMCID: PMC1201326
- DOI: 10.1371/journal.pcbi.0010036
A biophysical model of the mitochondrial respiratory system and oxidative phosphorylation
Erratum in
- PLoS Comput Biol. 2006 Jan;2(1):e8
Abstract
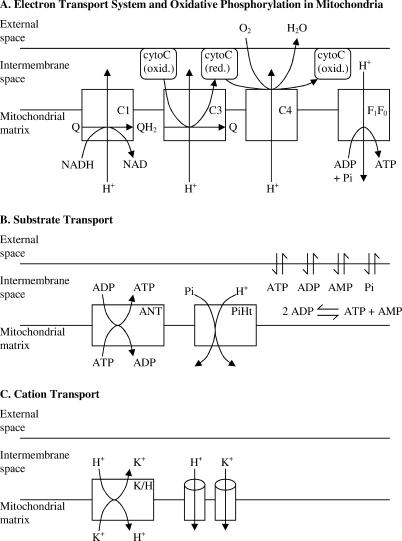
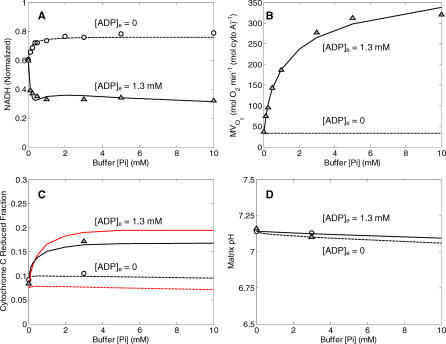
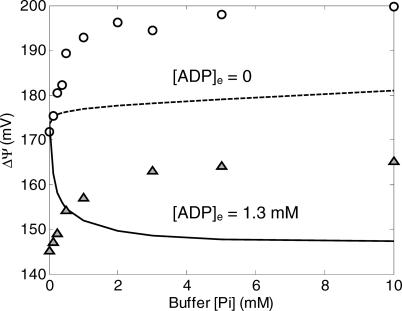
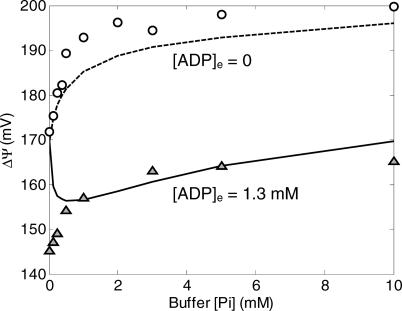
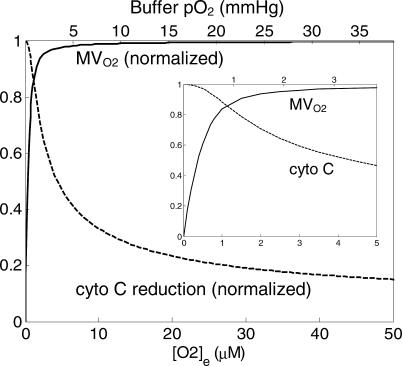
A computational model for the mitochondrial respiratory chain that appropriately balances mass, charge, and free energy transduction is introduced and analyzed based on a previously published set of data measured on isolated cardiac mitochondria. The basic components included in the model are the reactions at complexes I, III, and IV of the electron transport system, ATP synthesis at F1F0 ATPase, substrate transporters including adenine nucleotide translocase and the phosphate-hydrogen co-transporter, and cation fluxes across the inner membrane including fluxes through the K+/H+ antiporter and passive H+ and K+ permeation. Estimation of 16 adjustable parameter values is based on fitting model simulations to nine independent data curves. The identified model is further validated by comparison to additional datasets measured from mitochondria isolated from rat heart and liver and observed at low oxygen concentration. To obtain reasonable fits to the available data, it is necessary to incorporate inorganic-phosphate-dependent activation of the dehydrogenase activity and the electron transport system. Specifically, it is shown that a model incorporating phosphate-dependent activation of complex III is able to reasonably reproduce the observed data. The resulting validated and verified model provides a foundation for building larger and more complex systems models and investigating complex physiological and pathophysiological interactions in cardiac energetics.
Conflict of interest statement
Figures
Similar articles
-
Modeling of oxygen transport and cellular energetics explains observations on in vivo cardiac energy metabolism.PLoS Comput Biol. 2006 Sep 15;2(9):e107. doi: 10.1371/journal.pcbi.0020107. Epub 2006 Jul 10. PLoS Comput Biol. 2006. PMID: 16978045 Free PMC article.
-
Dynamic simulation of mitochondrial respiration and oxidative phosphorylation: comparison with experimental results.Acta Biotheor. 2008 Jun;56(1-2):157-72. doi: 10.1007/s10441-008-9035-z. Epub 2008 Jan 30. Acta Biotheor. 2008. PMID: 18231864
-
Effects of resveratrol on the rat brain respiratory chain.Drugs Exp Clin Res. 1999;25(2-3):87-97. Drugs Exp Clin Res. 1999. PMID: 10370869
-
Mitochondrial ATP-Pi exchange complex and the site of uncoupling of oxidative phosphorylation.Fed Proc. 1975 Jul;34(8):1699-706. Fed Proc. 1975. PMID: 1093889 Review.
-
Thermodynamic relationships in mitochondrial oxidative phosphorylation.Annu Rev Biophys Bioeng. 1974;3(0):203-30. doi: 10.1146/annurev.bb.03.060174.001223. Annu Rev Biophys Bioeng. 1974. PMID: 4153883 Review. No abstract available.
Cited by
-
Integrated Functions of Cardiac Energetics, Mechanics, and Purine Nucleotide Metabolism.Compr Physiol. 2023 Dec 29;14(1):5345-5369. doi: 10.1002/cphy.c230011. Compr Physiol. 2023. PMID: 38158366 Free PMC article.
-
Role of NADH/NAD+ transport activity and glycogen store on skeletal muscle energy metabolism during exercise: in silico studies.Am J Physiol Cell Physiol. 2009 Jan;296(1):C25-46. doi: 10.1152/ajpcell.00094.2008. Epub 2008 Oct 1. Am J Physiol Cell Physiol. 2009. PMID: 18829894 Free PMC article.
-
Effects of hyperoxia on mitochondrial multienzyme complex III and V in premature newborn rat lung.J Huazhong Univ Sci Technolog Med Sci. 2008 Apr;28(2):207-10. doi: 10.1007/s11596-008-0224-4. Epub 2008 May 15. J Huazhong Univ Sci Technolog Med Sci. 2008. PMID: 18481000
-
Glucose metabolism determines resistance of cancer cells to bioenergetic crisis after cytochrome-c release.Mol Syst Biol. 2011 Mar 1;7:470. doi: 10.1038/msb.2011.2. Mol Syst Biol. 2011. PMID: 21364572 Free PMC article.
-
Modeling of mitochondria bioenergetics using a composable chemiosmotic energy transduction rate law: theory and experimental validation.PLoS One. 2011;6(9):e14820. doi: 10.1371/journal.pone.0014820. Epub 2011 Sep 8. PLoS One. 2011. PMID: 21931590 Free PMC article.
References
-
- Qian H, Beard DA, Liang SD. Stoichiometric network theory for nonequilibrium biochemical systems. Eur J Biochem. 2003;270:415–421. - PubMed
-
- Beard DA, Qian H, Bassingthwaighte JB. Stoichiometric foundation of large-scale biochemical system analysis. In: Ciabanu G, Rozenberg G, editors. Modelling in molecular biology. New York: Springer; 2004. pp. 1–20.
-
- Qian H, Beard DA. Thermodynamics of stoichiometric biochemical networks in living systems far from equilibrium. Biophys Chem. 2005;114:213–220. - PubMed
-
- Korzeniewski B. Regulation of ATP supply in mammalian skeletal muscle during resting state→intensive work transition. Biophysical Chemistry. 2000;83:19–34. - PubMed
Publication types
MeSH terms
Substances
Grants and funding
LinkOut - more resources
Full Text Sources
Other Literature Sources
Molecular Biology Databases
