. 2006 Jan 1;107(1):87-97.
doi: 10.1182/blood-2005-07-2740. Epub 2005 Sep 6.

Early block to erythromegakaryocytic development conferred by loss of transcription factor GATA-1

Affiliations

Early block to erythromegakaryocytic development conferred by loss of transcription factor GATA-1

David L Stachura et al. Blood. .

Abstract

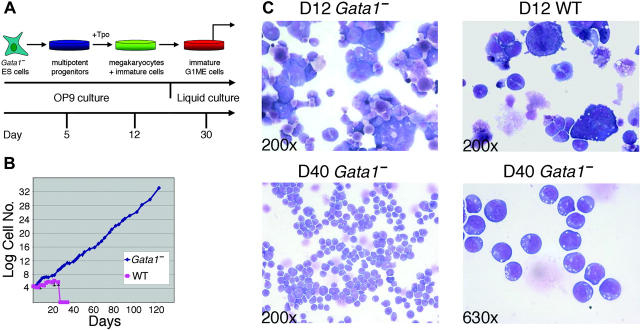
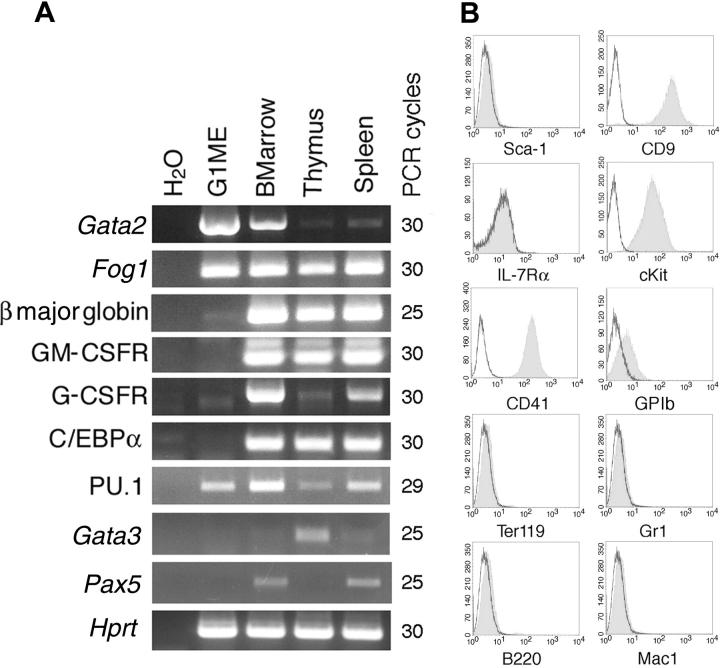
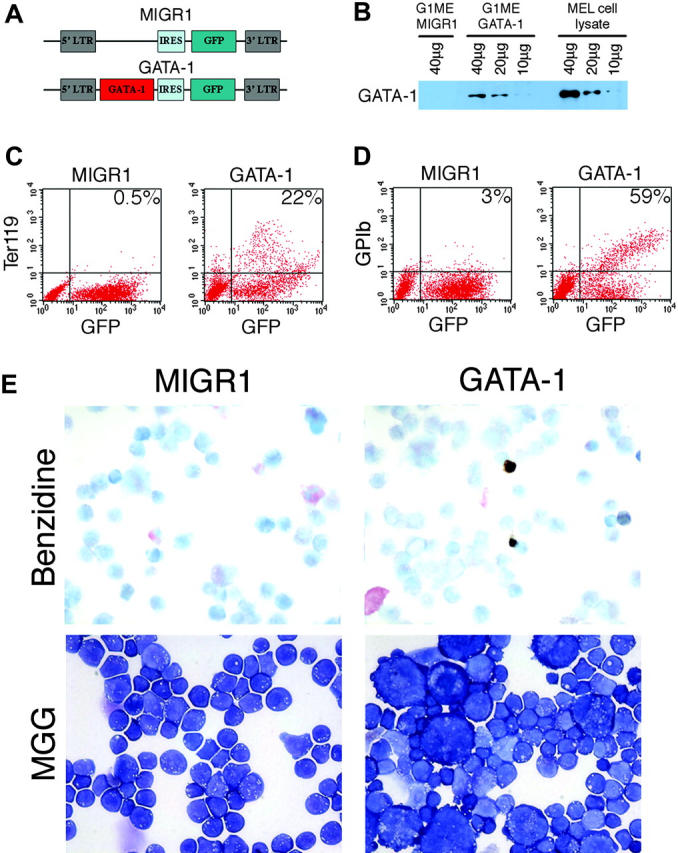
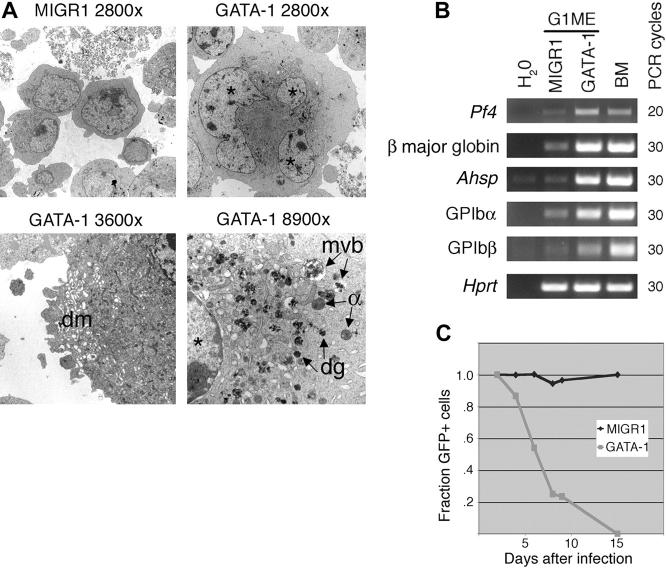
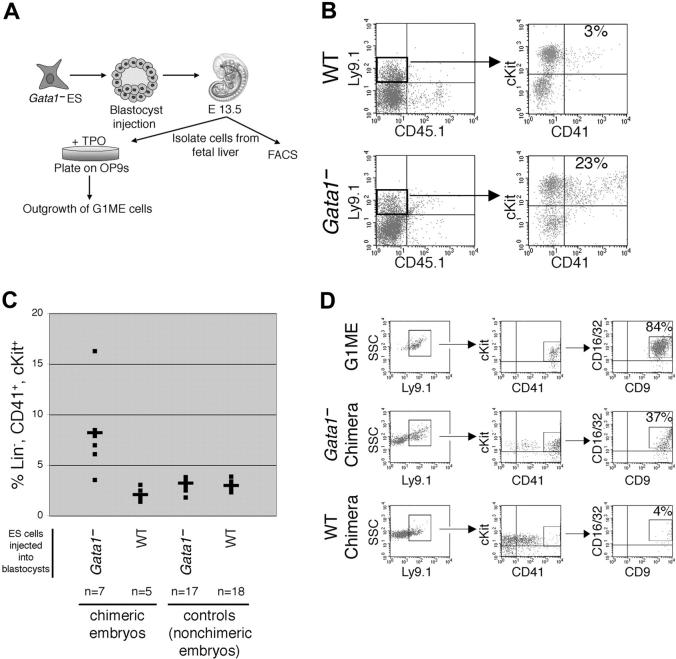
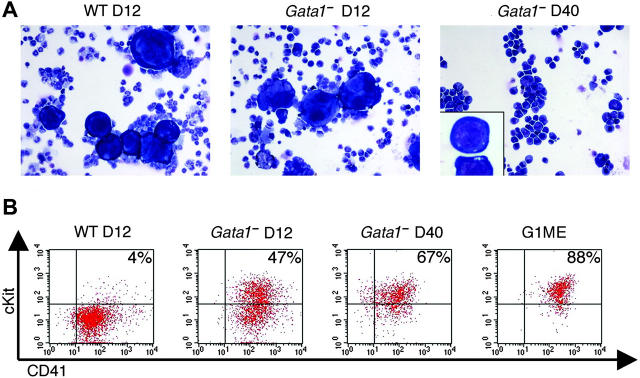
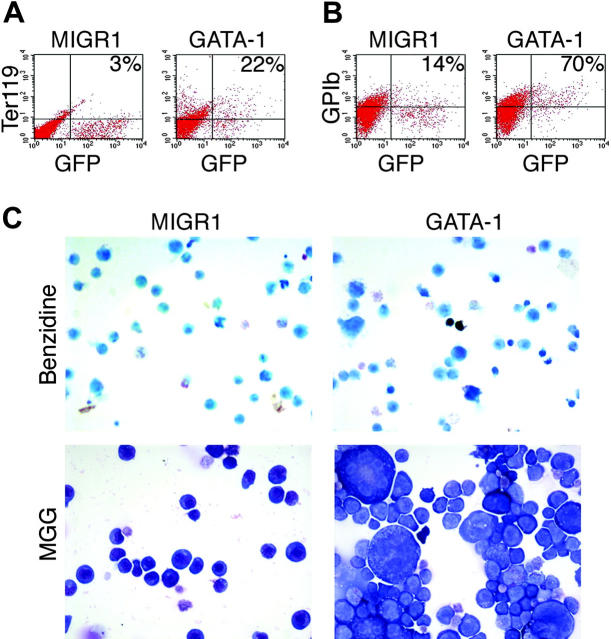
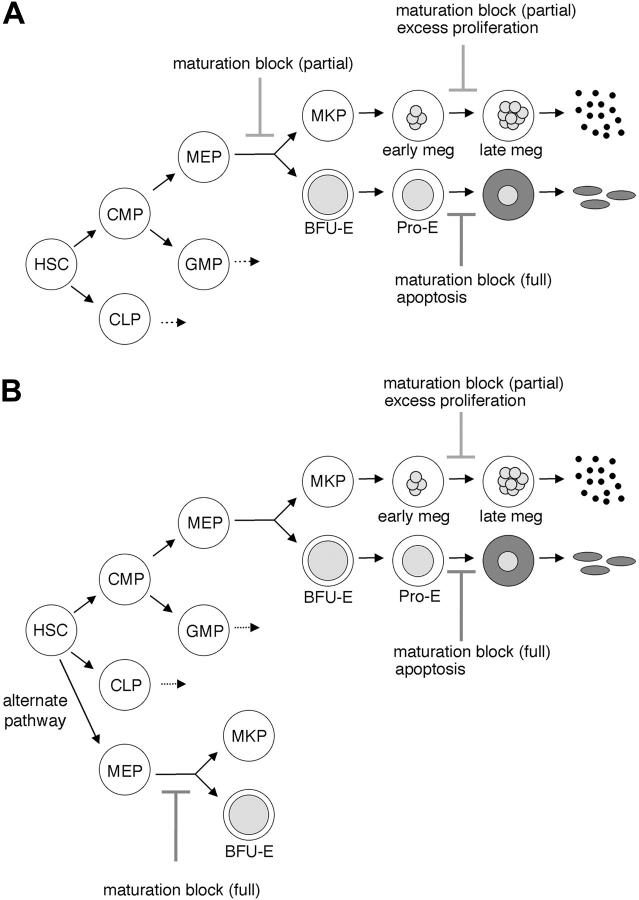
Transcription factor GATA-1 is essential at multiple stages of hematopoiesis. Murine gene targeting and analysis of naturally occurring human mutations demonstrate that GATA-1 drives the maturation of committed erythroid precursors and megakaryocytes. Prior studies also suggest additional, poorly defined, roles for GATA-1 at earlier stages of erythromegakaryocytic differentiation. To investigate these functions further, we stimulated Gata1- murine embryonic stem-cell-derived hematopoietic cultures with thrombopoietin, a multistage cytokine. Initially, the cultures generated a wave of mutant megakaryocytes. However, these were rapidly overgrown by a unique population of thrombopoietin-dependent blasts that express immature markers and proliferate indefinitely. Importantly, on restoration of GATA-1 function, these cells differentiated into both erythroid and megakaryocytic lineages, suggesting that they represent bipotential progenitors. Identical cells are also present in vivo, as indicated by flow cytometry and culture analysis of fetal livers from Gata1- chimeric mice. Our findings indicate that loss of GATA-1 impairs the maturation of megakaryocyte-erythroid progenitors. This defines a new role for GATA-1 at a relatively early stage of hematopoiesis and provides potential insight into recent discoveries that human GATA1 mutations promote acute megakaryoblastic leukemia, a clonal malignancy with features of both erythroid and megakaryocyte maturation.


Figures

Figure 1.
Figure 1.
Selective expansion of immature hematopoietic blasts from Gata1- ES-cell in vitro differentiation cultures. (A) Summary of the culture method used. wt or Gata1- ES cells were cultured on OP9 stromal cells for 5 days to generate multipotential hematopoietic progenitors. These were expanded and differentiated further on OP9 cells in the presence of Tpo. At about 3 weeks, nonadherent cells were removed from the OP9 stromal layer and transferred to liquid culture with Tpo. (B) Proliferation of nonadherent cells in differentiation cultures from Gata1- and wt ES cells. Cumulative cell numbers are plotted against time. One of 3 representative experiments is shown. (C) Morphology of cells after various times in culture. May-Gr̈nwald-Giemsa stain. The blast cells derived from Gata1- cultures are shown at day 40. We refer to cells at day 40 as GATA-1- megakaryocyte-erythroid (G1ME) cells because they exhibit erythromegakaryocytic potential, as demonstrated in Figure 3. Original magnification of top (day 12), × 200; bottom left (day 40), × 200; bottom right (day 40), × 630. Photographs were taken by using a microscope (Axioskop 2; Carl Zeiss) equipped with a color digital camera (Axiocam; Carl Zeiss).
Figure 2.
Figure 2.
Gene expression and cell-surface phenotype analyses of G1ME cells. (A) RT-PCR analysis. Bone marrow (BMarrow), spleen, and thymus were analyzed in parallel as controls. GM-CSFR indicates granulocyte macrophage colony-stimulating factor receptor; G-CSFR, granulocyte colony-stimulating factor receptor; Hprt, hypoxanthine phosphoribosyl transferase. PCR cycle numbers for each primer pair are shown at the right side of the panel. (B) Cell-surface marker phenotype assessed by flow cytometry. Antibody-stained cells are shown in filled curve. Open curves denote staining with appropriate isotype control antibodies. Murine bone marrow and/or thymus were used as positive controls (not shown).
Figure 3.
Figure 3.
GATA-1 induces erythromegakaryocytic maturation of G1ME cells. (A) Retroviral constructs used for gene rescue. The MIGR1 vector encodes green fluorescent protein (GFP) linked to an internal ribosome entry site (IRES). MIGR1-GATA-1 also contains the full-length coding region of murine GATA-1 cDNA. For panels B to E, cells were analyzed 3 days after retroviral transduction. Viral infection efficiencies assessed by flow cytometry for GFP expression were about 65% for MIGRI and 35% for MIGR1-GATA-1. (B) GATA-1 protein expression in transduced cells determined by Western blotting. The amount of whole-cell lysate analyzed in each lane is indicated. MEL cell lysate was analyzed in parallel for comparison (last 3 lanes). (C) Expression of the erythroid-specific surface marker Ter119. Percentages in panels refer to fraction of GFP+ cells expressing Ter119. Approximately 65% of MIGR1- and 30% of GATA-1-transduced cells were GFP+. (D) Expression of the terminal megakaryocyte maturation marker GPIb. Percentages in panels refer to fraction of GFP+ cells expressing GPIb. (E) Morphology of cells after GATA-1-induced maturation. The top panels show benzidine staining for hemoglobin, with dark brown benzidine-positive cells visible only in the GATA-1-rescued sample. From the flow cytometry results for Ter119 in panel 3C, roughly 6% of cells are expected to be benzidine positive. The bottom panels show May-Gr̈nwald-Giemsa (MGG) staining with large multinucleated megakaryocytes occurring specifically in the GATA-1-rescued sample. Original magnification, × 400. Photographs were taken by using a microscope (Axioskop 2; Carl Zeiss) equipped with a color digital camera (Axiocam; Carl Zeiss).
Figure 4.
Figure 4.
Erythromegakaryocytic maturation of G1ME cells. (A) Transmission electron microscopy demonstrating features of megakaryocytic maturation. Control (MIGR1-transduced) cells (top left) are small and lack features of differentiation. GATA-1-rescued cultures contain a population of large cells with megakaryocytic features, including dense chromatin around the periphery of the nuclei, large multilobed nuclei (*), multivesicular bodies (mvb), dense granules (dg), α granules (α), and a developing platelet-membrane demarcation system (dm). Original magnifications are indicated. Photographs were taken by using a microscope (208S transmission electron; Philips) equipped with a Hamamatsu digital camera (Hamamatsu, Japan) and analyzed with visualization software (Advanced Microscope Techniques). (B) RT-PCR analysis showing GATA-1 induction of both erythroid and megakaryocyte genes. Erythroid genes are β major globin and Ahsp. Megakaryocyte genes are platelet factor 4 (Pf4) and glycoprotein (GP) Ibα and Ibβ. PCR cycle numbers for each primer pair are shown at the right side of the panel. (C) GATA-1 induces proliferation arrest as part of terminal maturation. Transduced cells were analyzed by flow cytometry for GFP expression. The fraction of GFP+ cells was normalized to 1.0 at 2 days after retroviral infection and then followed over time. GFP-expressing cells transduced by vector grew normally, whereas GATA-1-expressing cells were outgrown by noninfected cells.
Figure 5.
Figure 5.
Development of G1ME cells in Gata1- chimeric embryos. (A) Experimental approach. Chimeric embryos were prepared by injecting Gata1- or wt ES cells into wt host blastocysts. Fetal liver hematopoietic cells from day 13.5 chimeric embryos were analyzed by FACS or cultured on OP9 cells with Tpo according to the same conditions used to derive G1ME cells from ES cells (Figure 1). The polymorphic cell-surface marker Ly9.1 was used to facilitate tracking of ES-cell donor-derived hematopoietic cells. Donor ES cells (strain 129) express Ly9.1 and CD45.2 (not shown), whereas host (C57/BL6) blastocyst-derived cells express Ly9.2 and CD45.1 (not shown). (B) Flow cytometry analysis of E13.5 fetal livers. Gata1- chimeric embryos contain an expanded population of donor-derived (Ly9.1) cells that are lineage negative, CD41+, and cKit+, identical to the surface phenotype of G1ME cells derived from in vitro differentiation of Gata1- ES cells, as described in Figure 1. Representative studies of fetal livers from wt and Gata1- chimera are shown. The wt chimeric fetal liver was 30% Ly9.1+, and the Gata1- chimeric fetal liver was 23% Ly9.1+. (C) CD41+ cKit+ cells as a percentage of lin- fetal liver cells. As indicated on the x-axis, embryos prepared from Gata1- or wt ES-cell-injected blastocysts were termed chimeric only if donor-derived Ly9.1 hematopoietic cells were detected in fetal livers. Levels of chimerism ranged from 2% to 23% in Gata1- chimeric animals, and 30% to 47% in wt chimeric fetal livers. (D) Additional cell-surface marker expression comparing G1ME cells (top) and E13.5 chimeric fetal livers (middle and bottom). Fetal livers from Gata1- or wt chimeric embryos were analyzed 4 days after expansion on OP9 stroma. All cells shown are lin-, IL7Rα-, and Sca1-. Left panels show the detection of donor cells (Ly9.1+). Middle panels show cKit and CD41 expression in Ly9.1+ cells; these are analyzed further for FcγR and CD9 expression in the right panels. Percentages in the right panels refer to lin-, IL7R-, Sca1-, CD9+, FcγRlo, CD41+, and ckit+ cells within the Ly9.1+ population.
Figure 6.
Figure 6.
Expansion of fetal liver-derived G1ME cells in long-term culture. (A) Cell morphologies at various times in culture (May-Gr̈nwald-Giemsa stain). Chimeric fetal livers were cultured on OP9 stroma with Tpo, according to the strategies in Figures 1 and 5. At day 12, a population of large, multinucleated megakaryocytes was visible in both wt and Gata1- cultures. By day 40, only the Gata1- cultures were growing and contained predominantly immature blasts (right) with morphology similar to ES-cell-derived G1ME cells (compare with Figure 1C). Original magnification, × 200; inset, × 630. Photographs were taken by using a microscope (Axioskop 2; Carl Zeiss) equipped with a color digital camera (Axiocam; Carl Zeiss). (B) Flow cytometry analysis of the cultures in panel A. The hematopoietic blasts from GATA-1- chimeric fetal liver cultures are predominantly cKit+ CD41+. These cells are also Ly9.1+ (data not shown), indicating that they are Gata1- donor ES cell-derived.
Figure 7.
Figure 7.
GATA-1 complementation induces erythromegakaryocytic maturation in Gata1- fetal liver chimera-derived G1ME cells. Cells were transduced with GATA-1 or control retrovirus and analyzed for maturation as described in Figure 3. (A) Ter119 expression after rescue by GATA-1. Percentages in top panels refer to fraction of GFP+ cells expressing Ter119. (B) GPIb expression after rescue by GATA-1. Percentages in panels refer to fraction of GFP+ cells expressing GPIb. (C) Cell morphology after retroviral expression; (top) benzidine stain for hemoglobin, (bottom) May-Gr̈nwald-Giemsa staining. Original magnification, × 400. Photographs were taken by using a microscope (Axioskop 2; Carl Zeiss) equipped with a color digital camera (Axiocam; Carl Zeiss).
Figure 8.
Figure 8.
Models for GATA-1 actions in MEPs. (A) The classic model for hematopoiesis in which MEPs derive from the CMP. Loss of GATA-1 generates recognizable, developmentally arrested megakaryocytes and committed erythroid precursors. Therefore, the earlier stage block to differentiation of Gata1- MEPs must be partial, because some downstream progeny are produced. GATA-1 is also required for eosinophil and mast-cell development (not shown). (B) Newer models for hematopoiesis indicate that alternate pathways may exist for MEP production. If multiple pathways exist simultaneously, then loss of GATA-1 may cause a complete block to one of these pathways with mutant erythroblasts and megakaryocytes generated through coexisting ones. HSC indicates hematopoietic stem cell; BFU-E, erythroid burst-forming unit; Pro-E, proerythroblast; meg, megakaryocyte; and CLP, common lymphoid progenitor.

Similar articles

Cited by

References

    1. Weiss MJ, Orkin SH. GATA transcription factors: key regulators of hematopoiesis. Exp Hematol. 1995;23: 99-107. - PubMed
    1. Ferreira R, Ohneda K, Yamamoto M, Philipsen S. GATA1 function, a paradigm for transcription factors in hematopoiesis. Mol Cell Biol. 2005;25: 1215-1227. - PMC - PubMed
    1. Heyworth C, Pearson S, May G, Enver T. Transcription factor-mediated lineage switching reveals plasticity in primary committed progenitor cells. EMBO J. 2002;21: 3770-3781. - PMC - PubMed
    1. Visvader J, Elefanty AG, Strasser A, Adams JM. GATA-1 but not SCL induces megakaryocytic differentiation in an early myeloid cell line. EMBO J. 1992;11: 4557-4564. - PMC - PubMed
    1. Fujiwara Y, Browne CP, Cunniff K, Goff SC, Orkin SH. Arrested development of embryonic red cell precursors in mouse embryos lacking transcription factor GATA-1. Proc Natl Acad Sci U S A. 1996;93: 12355-12358. - PMC - PubMed

Publication types

MeSH terms