

Osteoblast-derived PTHrP is a potent endogenous bone anabolic agent that modifies the therapeutic efficacy of administered PTH 1-34
- PMID: 16138191
- PMCID: PMC1193882
- DOI: 10.1172/JCI24918
Osteoblast-derived PTHrP is a potent endogenous bone anabolic agent that modifies the therapeutic efficacy of administered PTH 1-34
Abstract
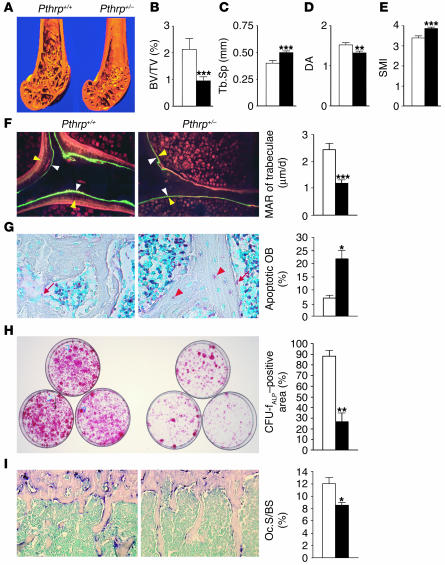
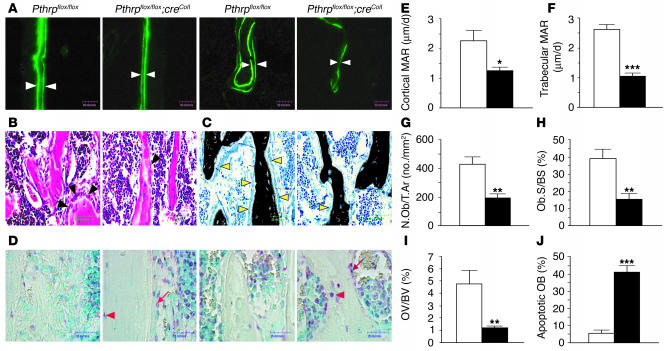
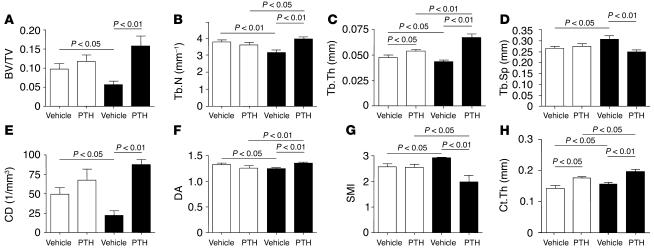
Mice heterozygous for targeted disruption of Pthrp exhibit, by 3 months of age, diminished bone volume and skeletal microarchitectural changes indicative of advanced osteoporosis. Impaired bone formation arising from decreased BM precursor cell recruitment and increased apoptotic death of osteoblastic cells was identified as the underlying mechanism for low bone mass. The osteoporotic phenotype was recapitulated in mice with osteoblast-specific targeted disruption of Pthrp, generated using Cre-LoxP technology, and defective bone formation was reaffirmed as the underlying etiology. Daily administration of the 1-34 amino-terminal fragment of parathyroid hormone (PTH 1-34) to Pthrp+/- mice resulted in profound improvement in all parameters of skeletal microarchitecture, surpassing the improvement observed in treated WT littermates. These findings establish a pivotal role for osteoblast-derived PTH-related protein (PTHrP) as a potent endogenous bone anabolic factor that potentiates bone formation by altering osteoblast recruitment and survival and whose level of expression in the bone microenvironment influences the therapeutic efficacy of exogenous PTH 1-34.
Figures


Comment in
-
Osteoblast-derived PTHrP is a physiological regulator of bone formation.J Clin Invest. 2005 Sep;115(9):2322-4. doi: 10.1172/JCI26239. J Clin Invest. 2005. PMID: 16138187 Free PMC article.
Similar articles
-
Current perspectives on parathyroid hormone (PTH) and PTH-related protein (PTHrP) as bone anabolic therapies.Biochem Pharmacol. 2013 May 15;85(10):1417-23. doi: 10.1016/j.bcp.2013.03.002. Epub 2013 Mar 13. Biochem Pharmacol. 2013. PMID: 23500550 Review.
-
Endogenous parathyroid hormone-related protein compensates for the absence of parathyroid hormone in promoting bone accrual in vivo in a model of bone marrow ablation.J Bone Miner Res. 2013 Sep;28(9):1898-911. doi: 10.1002/jbmr.2000. J Bone Miner Res. 2013. PMID: 23716486
-
Osteoblast-derived PTHrP is a physiological regulator of bone formation.J Clin Invest. 2005 Sep;115(9):2322-4. doi: 10.1172/JCI26239. J Clin Invest. 2005. PMID: 16138187 Free PMC article.
-
Role of parathyroid hormone-related protein in the decreased osteoblast function in diabetes-related osteopenia.Endocrinology. 2009 May;150(5):2027-35. doi: 10.1210/en.2008-1108. Epub 2009 Feb 5. Endocrinology. 2009. PMID: 19196804
-
Studies on the mechanisms of the skeletal anabolic action of endogenous and exogenous parathyroid hormone.Arch Biochem Biophys. 2008 May 15;473(2):218-24. doi: 10.1016/j.abb.2008.03.003. Epub 2008 Mar 10. Arch Biochem Biophys. 2008. PMID: 18358824 Review.
Cited by
-
Bone metabolism in the fetus and neonate.Pediatr Nephrol. 2014 May;29(5):793-803. doi: 10.1007/s00467-013-2461-4. Epub 2013 Mar 26. Pediatr Nephrol. 2014. PMID: 23529641 Review.
-
Chemistry as an expanding resource in protein science: fully synthetic and fully active human parathyroid hormone-related protein (1-141).Angew Chem Int Ed Engl. 2012 Dec 3;51(49):12263-7. doi: 10.1002/anie.201207603. Epub 2012 Nov 4. Angew Chem Int Ed Engl. 2012. PMID: 23124999 Free PMC article. No abstract available.
-
Identification of PTHrP(12-48) as a plasma biomarker associated with breast cancer bone metastasis.Cancer Epidemiol Biomarkers Prev. 2013 May;22(5):972-83. doi: 10.1158/1055-9965.EPI-12-1318-T. Epub 2013 Mar 5. Cancer Epidemiol Biomarkers Prev. 2013. PMID: 23462923 Free PMC article.
-
Parathyroid hormone-related protein for the treatment of postmenopausal osteoporosis: defining the maximal tolerable dose.J Clin Endocrinol Metab. 2010 Mar;95(3):1279-87. doi: 10.1210/jc.2009-0233. Epub 2010 Jan 8. J Clin Endocrinol Metab. 2010. PMID: 20061412 Free PMC article. Clinical Trial.
-
Activation of the Wnt pathway through AR79, a GSK3β inhibitor, promotes prostate cancer growth in soft tissue and bone.Mol Cancer Res. 2013 Dec;11(12):1597-610. doi: 10.1158/1541-7786.MCR-13-0332-T. Epub 2013 Oct 2. Mol Cancer Res. 2013. PMID: 24088787 Free PMC article.
References
-
- Seeman E. Reduced bone formation and increased bone resorption: rational targets for the treatment of osteoporosis. Osteoporos. Int. 2003;14(Suppl. 3):S2–S8. - PubMed
-
- Goltzman D. Discoveries, drugs and skeletal disorders. Nat. Rev. Drug Discov. 2002;1:784–796. - PubMed
-
- Juppner H, et al. A G protein-linked receptor for parathyroid hormone and parathyroid hormone-related peptide. Science. 1991;254:1024–1026. - PubMed
-
- Reeve J. PTH: a future role in the management of osteoporosis? [review] J. Bone Miner. Res. 1996;11:440–445. - PubMed
Publication types
MeSH terms
Substances
Grants and funding
LinkOut - more resources
Full Text Sources
Other Literature Sources
Molecular Biology Databases
Research Materials
