Comparative Study
. 2005 Sep;8(9):1179-87.
doi: 10.1038/nn1522. Epub 2005 Aug 14.

Nonsynaptic GABA signaling in postnatal subventricular zone controls proliferation of GFAP-expressing progenitors

Affiliations
Comparative Study

Nonsynaptic GABA signaling in postnatal subventricular zone controls proliferation of GFAP-expressing progenitors

Xiuxin Liu et al. Nat Neurosci. 2005 Sep.

Abstract

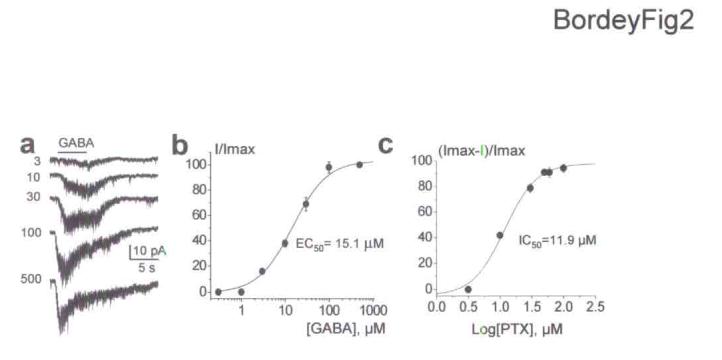
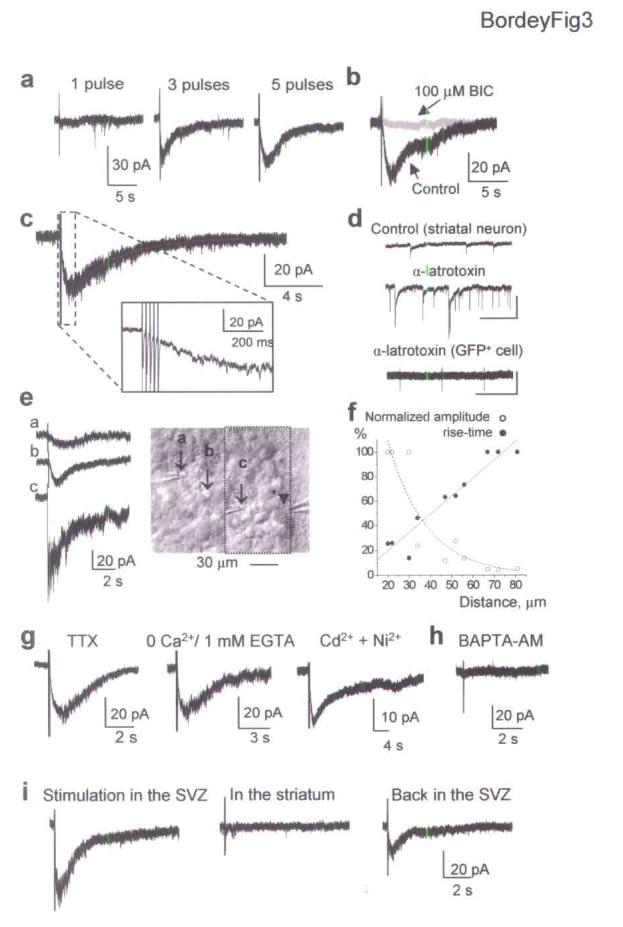
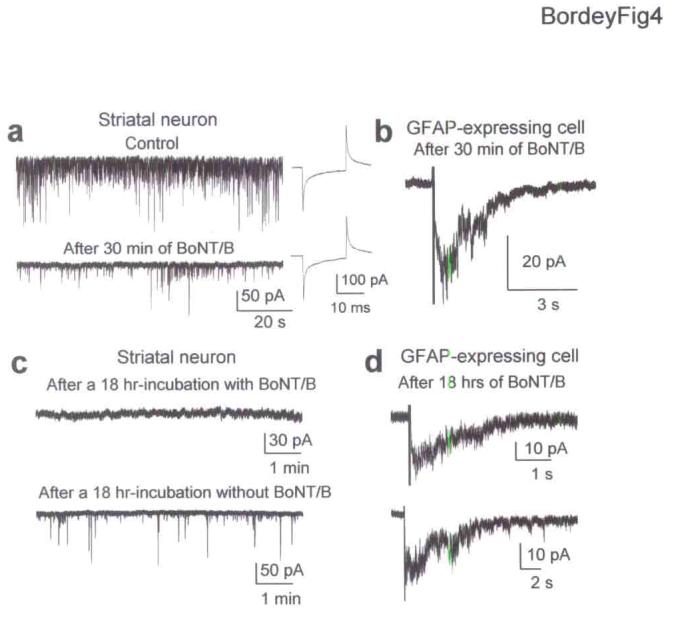
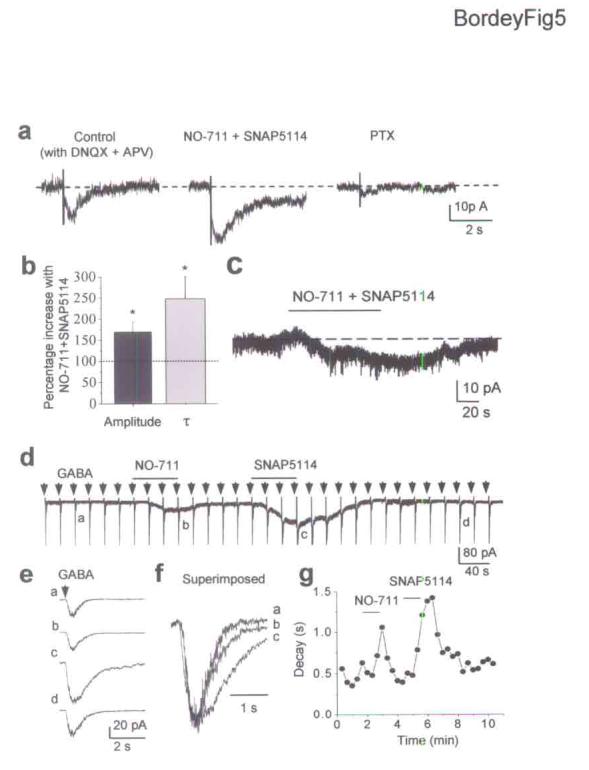
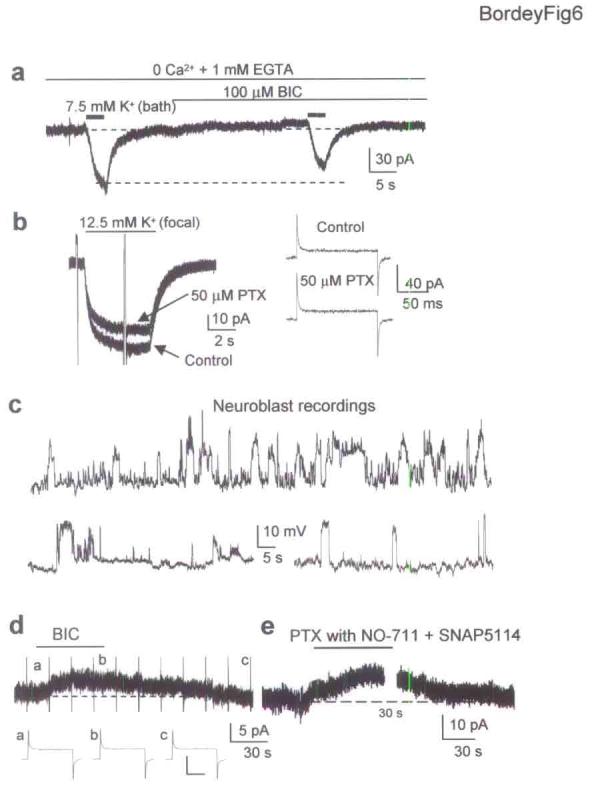
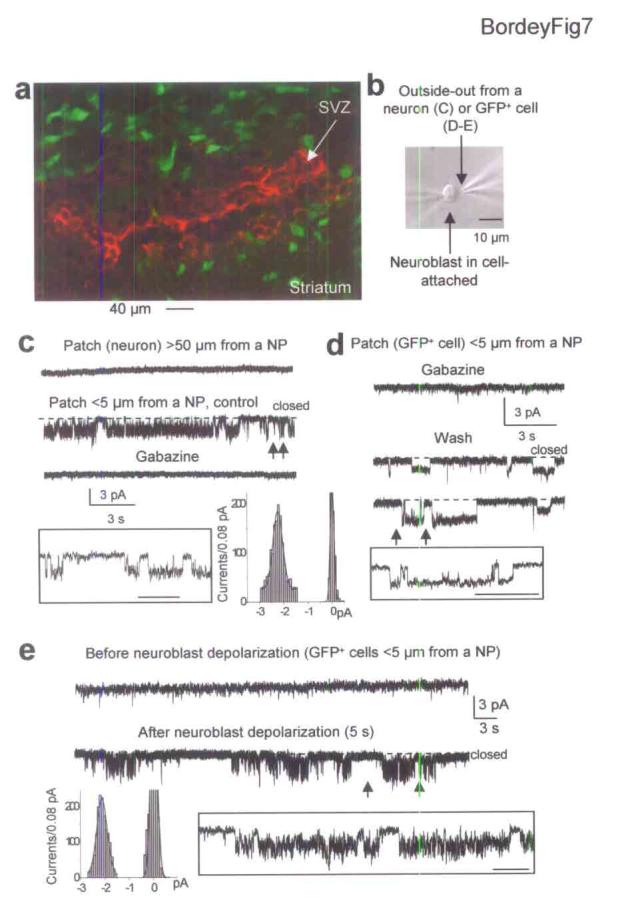
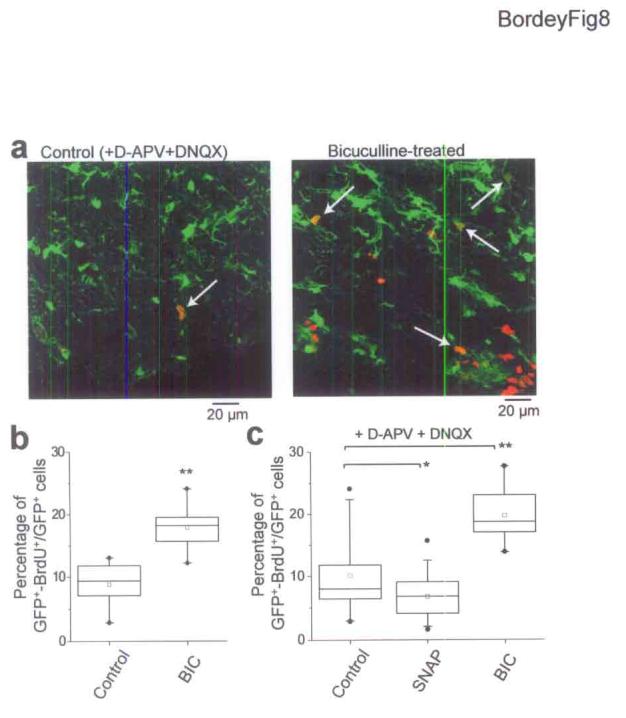
In the postnatal subventricular zone (SVZ), local cues or signaling molecules released from neuroblasts limit the proliferation of glial fibrillary acidic protein (GFAP)-expressing progenitors thought to be stem cells. However, signals between SVZ cells have not been identified. We show that depolarization of neuroblasts induces nonsynaptic SNARE-independent GABA(A) receptor currents in GFAP-expressing cells, the time course of which depends on GABA uptake in acute mouse slices. We found that GABA(A) receptors are tonically activated in GFAP-expressing cells, consistent with the presence of spontaneous depolarizations in neuroblasts that are sufficient to induce GABA release. These data demonstrate the existence of nonsynaptic GABAergic signaling between neuroblasts and GFAP-expressing cells. Furthermore, we show that GABA(A) receptor activation in GFAP-expressing cells limits their progression through the cell cycle. Thus, as GFAP-expressing cells generate neuroblasts, GABA released from neuroblasts provides a feedback mechanism to control the proliferation of GFAP-expressing progenitors by activating GABA(A) receptors.


Figures

Figure 1
Figure 1
GFAP-expressing cells in the SVZ express functional GABAARs. (a) Photograph of a cell recorded at the edge of the SVZ (upper). The recorded cell was GFP+. Photograph of the lucifer yellow (LY)-fill of the recorded cell (below). (b) Photograph of a LY-filled GFP+ cell (green) immunostained for nestin (red), a marker of immature cells. (c) GABA-induced currents before, and during application of MFA (100 μM). (d) Currents in response to a 10-mV hyperpolarizing pulse before and during MFA application from the same cell as in (C). (e) GABA-induced currents before and during application of the GABAAR antagonist, gabazine (50 μM). (f) Current-voltage curve of GABA responses obtained by applying a ramp protocol (from –120 to 0 mV in 200 ms) near the peak of the current. GABA response reverses at −55 mV as expected for a Cl-carried current in our recording conditions (ECl = −54 mV). GFP+ cells were recorded at a holding potential of –80 mV.
Figure 2
Figure 2
GABA and picrotoxin affinities for GABAARs in GFAP-expressing cells of the SVZ. (a) GABA responses induced by increasing GABA concentrations. (b-c) Mean dose-response curve for GABA (b) and picrotoxin (PTX, c) in GFAP-expressing cells gave an EC50 of 15.1 μM (n = 5) and an IC50 of 11.9 μM (n = 4), respectively. Four to six GABA concentrations were successively bath applied to each cell. The resulting averaged dose-response curve was fitted with a classical Hill equation. Errors bars represent s.e.m.
Figure 3
Figure 3
Electrical stimulation of SVZ progenitors evoked nonsynaptic GABAA currents in GFAP-expressing cells. (a) Repetitive focal electrical stimulation in the SVZ (1, 3 and 5 pulses of 200 μs, 50 Hz) induces inward currents in GFAP-expressing cells. (b) Currents evoked by a 5-pulse stimulus are reversibly blocked with bicuculline (BIC, 100 μM). (c) Evoked currents develop and decay slowly (Rise time: 680 ms and mono-exponential decay time constant: 1.7 s). Inset: trace at higher time scale. (d) Spontaneous synaptic events are observed in striatal neurons (top two traces) but not in GFAP-expressing cells (bottom trace) during 1 nM α-latrotoxin applications. Transient currents represent responses to 10-mV depolarizing pulses. Scale bars: 50 pA and 20 s (neuron), and 20 pA and 20 s (GFAP+ cell). (e) GABAA currents evoked by electrical stimulation at positions a, b and c shown (arrows) in the photograph. The arrowhead points to the recorded cell. (f) Plots of the normalized amplitudes and rise-times of evoked GABAA currents against the distance between the stimulating electrodes and recorded cells. (g) Evoked currents recorded with 1 μM TTX (left), in a 0-Ca2+ solution (30 min, middle), and in Cd2+ and Ni2+ for 30 min (each at 100 μM, right). (h) Failure to evoke currents recorded in slices incubated (30 min prior recording) in a Ca2+-free solution containing BAPTA-AM. (i) Focal electrical stimulation in the SVZ induces inward currents in GFAP-expressing cells recorded midway in the SVZ while no current was induced with an identical stimulation in the striatum.
Figure 4
Figure 4
GABA release from SVZ progenitors is SNARE-independent. (a) Spontaneous synaptic currents in a striatal neuron under control conditions and after 30 min application of 200 ng/ml BoNT/B. BoNT/B did not affect series resistance or cell capacitance measured by applying a 10 mV-hyperpolarizing pulse before and after BoNT/B application. (b) Evoked GABAA currents in GFAP-expressing cells after a 30 min-application of BoNT/B. (c) Records of synaptic activity in striatal neurons in slices incubated for 18 hrs in a solution with or without 100 ng/ml BoNT/B. (d) Evoked GABAA currents in GFAP-expressing cells in slices treated with BoNT/B for 18 hrs.
Figure 5
Figure 5
GABA uptake controls GABAAR activation in GFAP-expressing cells of the SVZ. (a) Bath application of GABA transporter antagonists, 50 μM NO-711 (for GAT1) and 50 μM SNAP5114 (for GAT3/4) enhances the amplitude and prolongs the decay time of PTX-sensitive currents evoked by tetanic stimulation in the SVZ. (b) Percentage increases of the evoked GABAA current amplitude and decay time constant in the presence of NO-711 and SNAP5114. Errors bars represent s.e.m. (c) NO-711 and SNAP5114 (50 μM each) reversibly induce an inward shift of the holding current in an GFAP-expressing cell. (d) Inward currents evoked by pressure applications of GABA (100 μM, 100 ms, every 20 s) before and during bath application of NO-711 (50 μM) and SNAP5114 (50 μM). Note that GABA responses were preceded by short 10 mV-depolarizations (transients on the records) to monitor the series and input resistance. In addition, NO-711 and SNAP5114 induced inward currents, suggesting that GABA transporter inhibition induced an increase in ambient GABA levels. (e) Average trace of three successive GABA responses at a higher time scale under control (a), in the presence of NO-711 (b) or SNAP5114 (c) and after washout (d). (f) Superimposed GABA responses (averaged) under control (a) and with NO-711 (b) or SNAP5114 (c). (g) Mono-exponential decay time constant of GABA response against the recording time.
Figure 6
Figure 6
Near-physiological depolarization of SVZ progenitors induces activation of GABAARs in GFAP-expressing cells that are also tonically activated. (a) Bath application of 7.5 mM K+ induces BIC-sensitive inward currents in an GFAP-expressing cell recorded in a Ca2+-free solution. (b) Focal pressure application of 12.5 mM K+ to a cluster of putative neuroblasts induced PTX-sensitive currents in GFAP-expressing cells. High K+ applications are not accompanied by changes in series (access) resistance or capacitance calculated in response to a 10 mV-depolarizing pulse applied before and during PTX application. (c) Spontaneous depolarizations of 15-20 mV in neuroblasts at −60 mV. (d) 100 μM BIC induces a 5 pA-outward shift of the holding current in an GFAP-expressing cell without affecting series resistance or cell capacitance measured by applying a 10 mV-depolarizing pulse before, during and after BIC application. The extracellular solution contained 2.5 mM K+. Scale bar: 100 pA, 20 ms. (e) 50 μM PTX induces a 20 pA-outward shift of the holding current in an GFAP-expressing cell in the presence of NO-711 and SNAP5114 (50 μM each).
Figure 7
Figure 7
Neuroblasts release GABA spontaneously and upon depolarization. (a) GABA immunostaining (red) in the SVZ of GFAPP-GFP mice. (b) Photograph of a neuroblast recorded in cell-attached above the slice. The second patch electrode contains an outside-out patch from a GFP+ cell (or a striatal neuron as in C) positioned < 5 μm from the simultaneously recorded neuroblast. (c) Simultaneous recordings from a cell-attached neuroblast (Vpip of 0 mV) and an outside-out patch from a striatal neuron held at −80 mV. No single channel activity is detected when the patch is 50 μm away from the neuroblast but channel activity is observed when the patch is < 5 μm from the neuroblast shown in (b) and is blocked by 20 μM gabazine. Insets: Higher time scale of the trace between the arrows and amplitude histogram of middle records. (d-e) Simultaneous recordings from a cell-attached neuroblast and an outside-out patch from a GFP+ cell positioned < 5 μm from the neuroblast. (d) No channel activity is observed when recording with 20 μM gabazine but single channel activity develops upon gabazine removal. (e) Spontaneous channel activity develops after a 5 s-long depolarization of the cell-attached neuroblast (Vpip from 0 to −120 mV). Insets: Traces between the arrows displayed at higher time scale. In (e), amplitude histogram of depolarization-induced channels. Scale bar in insets: 200, 500 and 500 μm in c, d and e, respectively. These experiments were performed in the presence of 20 μM DNQX and 50 μM D-APV but without MFA.
Figure 8
Figure 8
GABAAR activation limits the proliferation of GFAP-expressing cells. (a) Reconstructions of 10 μm z-stacks of BrdU (red) and GFP (green) immunostaining in control and BIC-treated slices. White arrows indicate some GFP+ cells that are BrdU+. The reconstructed stack in the BIC-treated slice included a region outside the SVZ. BrdU+ cells were within the SVZ. (b) Percentage of GFP+ cells that are BrdU+ in control and in 50 μM BIC-treated slices. (c) Percentage of GFP+ cells that are BrdU+ in control in the presence of AMPA/kainate and NMDA receptor blockers (20 μM DNQX and 50 μM D-APV, respectively) and in 50 μM BIC- or 100 μM SNAP5114 (SNAP)-treated slices. SNAP-5114 is a non-transportable blocker of GAT4 transporters. *: P < 0.05, **: P < 0.001 (unpaired t-test with unequal variance), box: 25th and 75th percentiles, upper and lower bars: 5th and 95th percentiles, •: minimum and maximum, □: mean, middle bar: median.

Comment in

  • GABA puts the brake on stem cells.
    Kriegstein AR. Kriegstein AR. Nat Neurosci. 2005 Sep;8(9):1132-3. doi: 10.1038/nn0905-1132. Nat Neurosci. 2005. PMID: 16127444 No abstract available.

Similar articles

Cited by

References

    1. Doetsch F, Garcia-Verdugo JM, Alvarez-Buylla A. Cellular composition and three-dimensional organization of the subventricular germinal zone in the adult mammalian brain. J. Neurosci. 1997;17:5046–5061. - PMC - PubMed
    1. Lois C, Garcia-Verdugo JM, Alvarez-Buylla A. Chain migration of neuronal precursors. Science. 1996;271:978–981. - PubMed
    1. Luskin MB, Zigova T, Soteres BJ, Stewart RR. Neuronal progenitor cells derived from the anterior subventricular zone of the neonatal rat forebrain continue to proliferate in vitro and express a neuronal phenotype. Mol. Cell Neurosci. 1997;8:351–366. - PubMed
    1. Belluzzi O, Benedusi M, Ackman J, LoTurco JJ. Electrophysiological differentiation of new neurons in the olfactory bulb. J. Neurosci. 2003;23:10411–10418. - PMC - PubMed
    1. Carleton A, Petreanu LT, Lansford R, Alvarez-Buylla A, Lledo PM. Becoming a new neuron in the adult olfactory bulb. Nat. Neurosci. 2003;6:507–518. - PubMed

Publication types

MeSH terms