

Estimating the tempo and mode of gene family evolution from comparative genomic data
- PMID: 16077014
- PMCID: PMC1182228
- DOI: 10.1101/gr.3567505
Estimating the tempo and mode of gene family evolution from comparative genomic data
Abstract
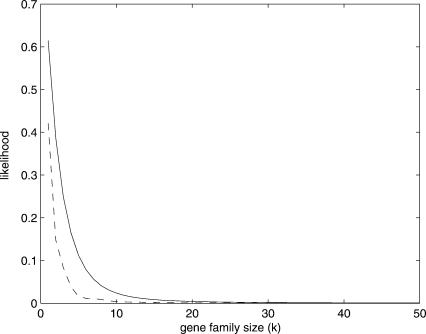
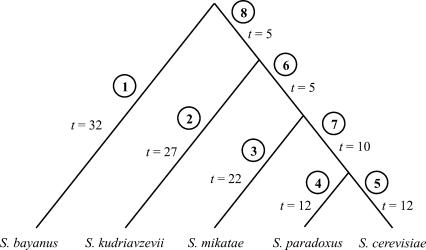
Comparison of whole genomes has revealed that changes in the size of gene families among organisms is quite common. However, there are as yet no models of gene family evolution that make it possible to estimate ancestral states or to infer upon which lineages gene families have contracted or expanded. In addition, large differences in family size have generally been attributed to the effects of natural selection, without a strong statistical basis for these conclusions. Here we use a model of stochastic birth and death for gene family evolution and show that it can be efficiently applied to multispecies genome comparisons. This model takes into account the lengths of branches on phylogenetic trees, as well as duplication and deletion rates, and hence provides expectations for divergence in gene family size among lineages. The model offers both the opportunity to identify large-scale patterns in genome evolution and the ability to make stronger inferences regarding the role of natural selection in gene family expansion or contraction. We apply our method to data from the genomes of five yeast species to show its applicability.
Figures
Similar articles
-
Modeling gene family evolution and reconciling phylogenetic discord.Methods Mol Biol. 2012;856:29-51. doi: 10.1007/978-1-61779-585-5_2. Methods Mol Biol. 2012. PMID: 22399454
-
Placing paleopolyploidy in relation to taxon divergence: a phylogenetic analysis in legumes using 39 gene families.Syst Biol. 2005 Jun;54(3):441-54. doi: 10.1080/10635150590945359. Syst Biol. 2005. PMID: 16012110
-
Evolution of a microbial nitrilase gene family: a comparative and environmental genomics study.BMC Evol Biol. 2005 Aug 6;5:42. doi: 10.1186/1471-2148-5-42. BMC Evol Biol. 2005. PMID: 16083508 Free PMC article.
-
Genome duplication and gene-family evolution: the case of three OXPHOS gene families.Gene. 2008 Sep 15;421(1-2):1-6. doi: 10.1016/j.gene.2008.05.011. Epub 2008 Jun 23. Gene. 2008. PMID: 18573316 Review.
-
The birth-and-death evolution of multigene families revisited.Genome Dyn. 2012;7:170-96. doi: 10.1159/000337119. Epub 2012 Jun 25. Genome Dyn. 2012. PMID: 22759819 Review.
Cited by
-
Real-Time Evolution of a Subtelomeric Gene Family in Candida albicans.Genetics. 2015 Jul;200(3):907-19. doi: 10.1534/genetics.115.177451. Epub 2015 May 8. Genetics. 2015. PMID: 25956943 Free PMC article.
-
Neocortex expansion is linked to size variations in gene families with chemotaxis, cell-cell signalling and immune response functions in mammals.Open Biol. 2016 Oct;6(10):160132. doi: 10.1098/rsob.160132. Open Biol. 2016. PMID: 27707894 Free PMC article.
-
The draft genome of the specialist flea beetle Altica viridicyanea (Coleoptera: Chrysomelidae).BMC Genomics. 2021 Apr 7;22(1):243. doi: 10.1186/s12864-021-07558-6. BMC Genomics. 2021. PMID: 33827435 Free PMC article.
-
An atlas of the speed of copy number changes in animal gene families and its implications.PLoS One. 2009 Oct 23;4(10):e7342. doi: 10.1371/journal.pone.0007342. PLoS One. 2009. PMID: 19851465 Free PMC article.
-
Modifying Saccharomyces cerevisiae Adhesion Properties Regulates Yeast Ecosystem Dynamics.mSphere. 2018 Oct 24;3(5):e00383-18. doi: 10.1128/mSphere.00383-18. mSphere. 2018. PMID: 30355663 Free PMC article.
References
-
- Abril, J.F., Agarwal, P., Alexandersson, M., Antonarakis, S.E., Baertsch, R., Berry, E., Birney, E., Bork, P., Bray, N., Brent, M.R., et al. 2002. Initial sequencing and comparative analysis of the mouse genome. Nature 420: 520–562. - PubMed
-
- Bailey, N. 1964. The elements of stochastic processes. John Wiley & Sons, Inc., New York.
-
- Berger, R.L. and Boos, D.D. 1994. P values maximized over a confidence set for the nuisance parameter. J. Amer. Statist. Assoc. 89: 1012–1016.
-
- Cliften, P., Sudarsanam, P., Desikan, A., Fulton, L., Fulton, B., Majors, J., Waterston, R., Cohen, B.A., and Johnston, M. 2003. Finding functional features in Saccharomyces genomes by phylogenetic footprinting. Science 301: 71–76. - PubMed
-
- Copley, R., Goodstadt, L., and Ponting, C. 2003. Eukaryotic domain evolution inferred from genome comparisons. Curr. Opin. Genet. Dev. 13: 623–628. - PubMed
Publication types
MeSH terms
LinkOut - more resources
Full Text Sources
Molecular Biology Databases