Disruption of coordinated cardiac hypertrophy and angiogenesis contributes to the transition to heart failure
- PMID: 16075055
- PMCID: PMC1180541
- DOI: 10.1172/JCI24682
Disruption of coordinated cardiac hypertrophy and angiogenesis contributes to the transition to heart failure
Abstract
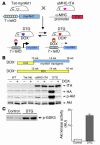
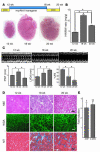
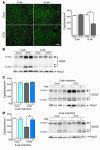
Although increased external load initially induces cardiac hypertrophy with preserved contractility, sustained overload eventually leads to heart failure through poorly understood mechanisms. Here we describe a conditional transgenic system in mice characterized by the sequential development of adaptive cardiac hypertrophy with preserved contractility in the acute phase and dilated cardiomyopathy in the chronic phase following the induction of an activated Akt1 gene in the heart. Coronary angiogenesis was enhanced during the acute phase of adaptive cardiac growth but reduced as hearts underwent pathological remodeling. Enhanced angiogenesis in the acute phase was associated with mammalian target of rapamycin-dependent induction of myocardial VEGF and angiopoietin-2 expression. Inhibition of angiogenesis by a decoy VEGF receptor in the acute phase led to decreased capillary density, contractile dysfunction, and impaired cardiac growth. Thus, both heart size and cardiac function are angiogenesis dependent, and disruption of coordinated tissue growth and angiogenesis in the heart contributes to the progression from adaptive cardiac hypertrophy to heart failure.
Figures


Comment in
-
Akt1 in the cardiovascular system: friend or foe?J Clin Invest. 2005 Aug;115(8):2059-64. doi: 10.1172/JCI25900. J Clin Invest. 2005. PMID: 16075047 Free PMC article.
Similar articles
-
Adiponectin deficiency exacerbates cardiac dysfunction following pressure overload through disruption of an AMPK-dependent angiogenic response.J Mol Cell Cardiol. 2010 Aug;49(2):210-20. doi: 10.1016/j.yjmcc.2010.02.021. Epub 2010 Mar 4. J Mol Cell Cardiol. 2010. PMID: 20206634 Free PMC article.
-
Akt3 overexpression in the heart results in progression from adaptive to maladaptive hypertrophy.J Mol Cell Cardiol. 2005 Feb;38(2):375-85. doi: 10.1016/j.yjmcc.2004.12.002. Epub 2005 Jan 25. J Mol Cell Cardiol. 2005. PMID: 15698844
-
Vascular endothelial growth factor blockade prevents the beneficial effects of β-blocker therapy on cardiac function, angiogenesis, and remodeling in heart failure.Circ Heart Fail. 2013 Nov;6(6):1259-67. doi: 10.1161/CIRCHEARTFAILURE.113.000329. Epub 2013 Sep 12. Circ Heart Fail. 2013. PMID: 24029661
-
Angiogenesis and cardiac hypertrophy: maintenance of cardiac function and causative roles in heart failure.Circ Res. 2014 Jan 31;114(3):565-71. doi: 10.1161/CIRCRESAHA.114.300507. Circ Res. 2014. PMID: 24481846 Review.
-
Growth hormone, acromegaly, and heart failure: an intricate triangulation.Clin Endocrinol (Oxf). 2003 Dec;59(6):660-71. doi: 10.1046/j.1365-2265.2003.01780.x. Clin Endocrinol (Oxf). 2003. PMID: 14974906 Review.
Cited by
-
Low birth weight activates the renin-angiotensin system, but limits cardiac angiogenesis in early postnatal life.Physiol Rep. 2015 Feb 3;3(2):e12270. doi: 10.14814/phy2.12270. Print 2015 Feb 1. Physiol Rep. 2015. PMID: 25649246 Free PMC article.
-
Camrelizumab plus apatinib in patients with advanced or recurrent endometrial cancer after failure of at least one prior systemic therapy (CAP 04): a single-arm phase II trial.BMC Med. 2024 Aug 26;22(1):344. doi: 10.1186/s12916-024-03564-z. BMC Med. 2024. PMID: 39183277 Free PMC article. Clinical Trial.
-
Aldosterone promotes cardiac endothelial cell proliferation in vivo.J Am Heart Assoc. 2015 Jan 6;4(1):e001266. doi: 10.1161/JAHA.114.001266. J Am Heart Assoc. 2015. PMID: 25564371 Free PMC article.
-
In Vivo Inhibition of miR-34a Modestly Limits Cardiac Enlargement and Fibrosis in a Mouse Model with Established Type 1 Diabetes-Induced Cardiomyopathy, but Does Not Improve Diastolic Function.Cells. 2022 Oct 3;11(19):3117. doi: 10.3390/cells11193117. Cells. 2022. PMID: 36231079 Free PMC article.
-
Cardiomyocyte crosstalk with endothelium modulates cardiac structure, function, and ischemia-reperfusion injury susceptibility through erythropoietin.Front Physiol. 2024 Jul 1;15:1397049. doi: 10.3389/fphys.2024.1397049. eCollection 2024. Front Physiol. 2024. PMID: 39011088 Free PMC article.
References
-
- Braunwald, E., Colucci, W.S., and Grossman, W. 1997. Clinical aspects of heart failure: high-output heart failure; pulmonary edema. In Heart disease: a textbook of cardiovascular medicine. E. Braunwald, editor. W. B. Sanders. Philadelphia, Pennsylvania, USA. 445–470.
-
- American Heart Association. 2004. Heart diseases and stroke statistics: 2005 update. American Heart Association. Dallas, Texas, USA. http://www.americanheart.org/presenter.jhtml?identifier=1928.
-
- Olivetti G, Capasso JM, Meggs LG, Sonnenblick EH, Anversa P. Cellular basis of chronic ventricular remodeling after myocardial infarction in rats. Circ. Res. 1991;68:856–869. - PubMed
-
- Gerdes AM, et al. Structural remodeling of cardiac myocytes in patients with ischemic cardiomyopathy. Circulation. 1992;86:426–430. - PubMed
-
- Levy D, Garrison RJ, Savage DD, Kannel WB, Castelli WP. Prognostic implications of echocardiographically determined left ventricular mass in the Framingham Heart Study. N. Engl. J. Med. 1990;322:1561–1566. - PubMed
Publication types
MeSH terms
Substances
Grants and funding
LinkOut - more resources
Full Text Sources
Other Literature Sources
Medical
Molecular Biology Databases
Miscellaneous

