

Mechanism of HIF-1alpha-dependent suppression of hypoxia-induced apoptosis in squamous cell carcinoma cells
- PMID: 16053510
- PMCID: PMC11158431
- DOI: 10.1111/j.1349-7006.2005.00065.x
Mechanism of HIF-1alpha-dependent suppression of hypoxia-induced apoptosis in squamous cell carcinoma cells
Abstract
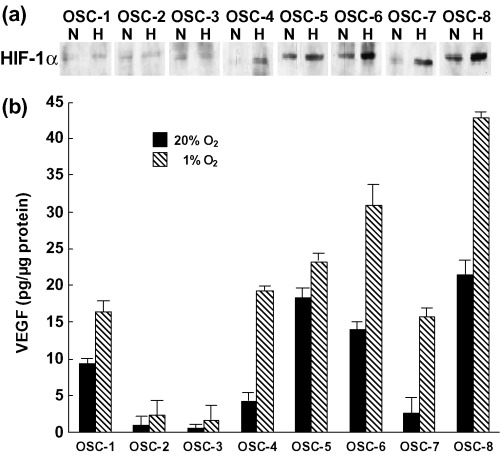
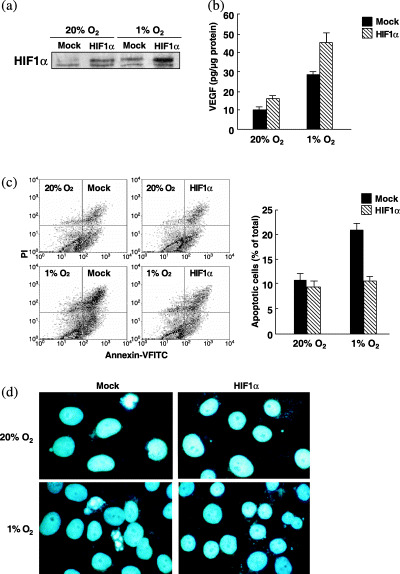
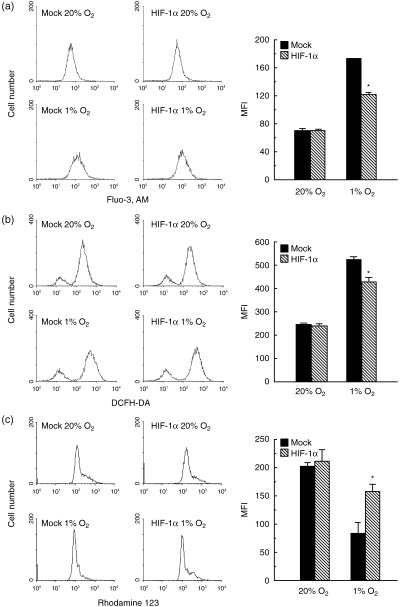
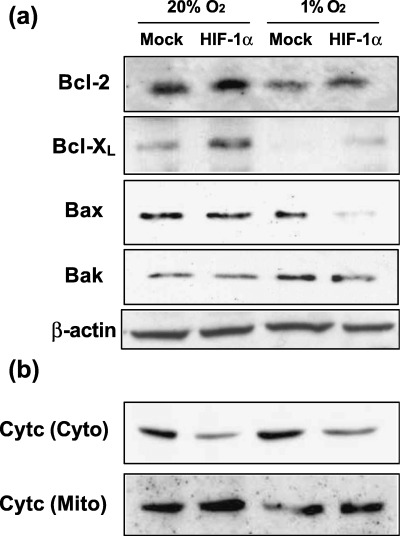
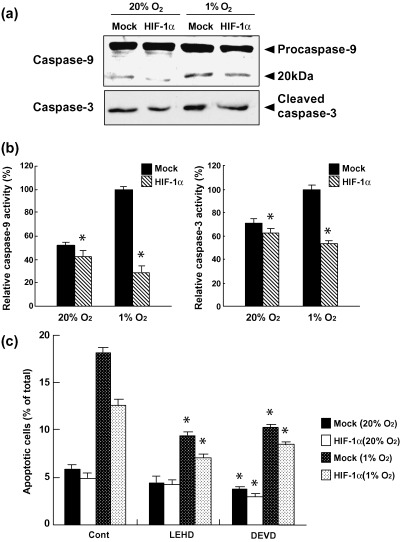
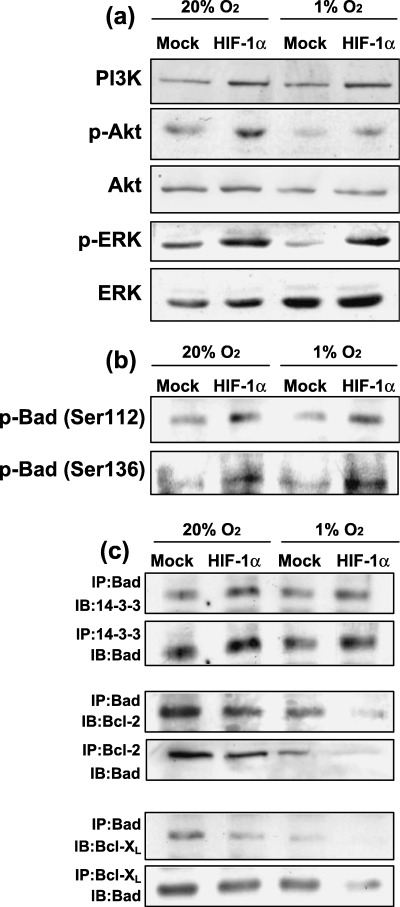
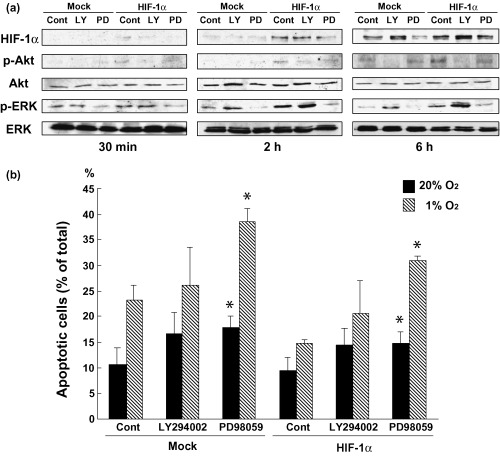
The transcriptional factor hypoxia-inducible factor-1 (HIF-1) plays an important role in solid tumor cell growth and survival. Overexpression of HIF-1alpha has been demonstrated in many human tumors and predicts a poor response to chemoradiotherapy. We examined the HIF-1alpha-induced survival pathways in human oral squamous cell carcinoma cell (OSCC) lines. The results showed that forced expression of HIF-1alpha suppressed hypoxia-induced apoptosis of OSCC lines by inhibiting cytochrome c release from mitochondria. Overexpression of HIF-1alpha inhibited the generation of reactive oxygen species (ROS), elevation of intracellular Ca(2+) concentration, reduction of mitochondrial membrane potential, and cytosolic accumulation of cytochrome c, which resulted in the inactivation of caspase-9 and caspase-3. In addition, antiapoptotic Bcl-2 and Bcl-X(L) levels were increased and pro-apoptotic Bax and Bak levels were decreased in the HIF-1alpha-overexpressing OSCC line. Overexpression of HIF-1alpha also increased the levels of phosphorylation of Akt and extracellular signal-regulated kinases (ERK). These findings indicate that HIF-1alpha prevents apoptotic cell death through two mechanisms, including inhibition of cytochrome c release and activation of Akt and ERK.
Copyright 2005 S. Karger AG, Basel.
Figures
Similar articles
-
Anti-cancer properties of glucosamine-hydrochloride in YD-8 human oral cancer cells: Induction of the caspase-dependent apoptosis and down-regulation of HIF-1α.Toxicol In Vitro. 2012 Feb;26(1):42-50. doi: 10.1016/j.tiv.2011.10.005. Epub 2011 Oct 13. Toxicol In Vitro. 2012. PMID: 22020377
-
Hypoxia-inducible factor 1alpha and antiangiogenic activity of farnesyltransferase inhibitor SCH66336 in human aerodigestive tract cancer.J Natl Cancer Inst. 2005 Sep 7;97(17):1272-86. doi: 10.1093/jnci/dji251. J Natl Cancer Inst. 2005. PMID: 16145048
-
Isocudraxanthone K induces growth inhibition and apoptosis in oral cancer cells via hypoxia inducible factor-1α.Biomed Res Int. 2014;2014:934691. doi: 10.1155/2014/934691. Epub 2014 Jul 3. Biomed Res Int. 2014. PMID: 25105148 Free PMC article.
-
Reactive oxygen species produced by the knockdown of manganese-superoxide dismutase up-regulate hypoxia-inducible factor-1alpha expression in oral squamous cell carcinoma cells.Free Radic Biol Med. 2010 May 15;48(10):1321-9. doi: 10.1016/j.freeradbiomed.2010.02.013. Epub 2010 Feb 24. Free Radic Biol Med. 2010. PMID: 20188165
-
Salvianolic acid B inhibits glycolysis in oral squamous cell carcinoma via targeting PI3K/AKT/HIF-1α signaling pathway.Cell Death Dis. 2018 May 22;9(6):599. doi: 10.1038/s41419-018-0623-9. Cell Death Dis. 2018. PMID: 29789538 Free PMC article.
Cited by
-
Preconditioning of bone marrow mesenchymal stem cells by prolyl hydroxylase inhibition enhances cell survival and angiogenesis in vitro and after transplantation into the ischemic heart of rats.Stem Cell Res Ther. 2014 Sep 25;5(5):111. doi: 10.1186/scrt499. Stem Cell Res Ther. 2014. PMID: 25257482 Free PMC article.
-
Hypoxia-induced alternative splicing in human diseases: the pledge, the turn, and the prestige.Cell Mol Life Sci. 2021 Mar;78(6):2729-2747. doi: 10.1007/s00018-020-03727-0. Epub 2021 Jan 2. Cell Mol Life Sci. 2021. PMID: 33386889 Free PMC article. Review.
-
Neuroadaptive Biochemical Mechanisms of Remote Ischemic Conditioning.Int J Mol Sci. 2023 Dec 1;24(23):17032. doi: 10.3390/ijms242317032. Int J Mol Sci. 2023. PMID: 38069355 Free PMC article. Review.
-
Hypoxia-induced modulation of apoptosis and BCL-2 family proteins in different cancer cell types.PLoS One. 2012;7(11):e47519. doi: 10.1371/journal.pone.0047519. Epub 2012 Nov 5. PLoS One. 2012. PMID: 23139748 Free PMC article.
-
Protection of cells in physiological oxygen tensions against DNA damage-induced apoptosis.J Biol Chem. 2010 Apr 30;285(18):13658-65. doi: 10.1074/jbc.M109.062562. Epub 2010 Mar 12. J Biol Chem. 2010. PMID: 20228054 Free PMC article.
References
MeSH terms
Substances
LinkOut - more resources
Full Text Sources
Other Literature Sources
Medical
Research Materials
Miscellaneous
