. 2005 Aug 1;202(3):415-24.
doi: 10.1084/jem.20050828. Epub 2005 Jul 25.

Multiple organ infection and the pathogenesis of SARS

Affiliations

Multiple organ infection and the pathogenesis of SARS

Jiang Gu et al. J Exp Med. .

Abstract

After >8,000 infections and >700 deaths worldwide, the pathogenesis of the new infectious disease, severe acute respiratory syndrome (SARS), remains poorly understood. We investigated 18 autopsies of patients who had suspected SARS; 8 cases were confirmed as SARS. We evaluated white blood cells from 22 confirmed SARS patients at various stages of the disease. T lymphocyte counts in 65 confirmed and 35 misdiagnosed SARS cases also were analyzed retrospectively. SARS viral particles and genomic sequence were detected in a large number of circulating lymphocytes, monocytes, and lymphoid tissues, as well as in the epithelial cells of the respiratory tract, the mucosa of the intestine, the epithelium of the renal distal tubules, the neurons of the brain, and macrophages in different organs. SARS virus seemed to be capable of infecting multiple cell types in several organs; immune cells and pulmonary epithelium were identified as the main sites of injury. A comprehensive theory of pathogenesis is proposed for SARS with immune and lung damage as key features.


Figures

Figure 1.
Figure 1.
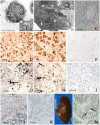
SARS pathology in the respiratory tract. (A) Lung of a SARS victim. The cut surface showed severe edema, consolidation, and hemorrhage. (B) LM of hematoxylin and eosin preparation of a SARS lung. The interstitial tissue was thickened with fibrin exudation and organization. Many alveoli were collapsed, filled with fluid, and exhibited hyaline membranes. Cellular infiltration was not obvious. Bar, 50 μm. (C) In situ hybridization of SARS genomic sequence of the lung from a SARS victim who died 62 d after the onset of high fever detected a large number of pulmonary epithelial cells (small arrows) that contained the virus. Multinuclear giant syncytial cells found in the alveoli contained a large amount of SARS viral sequences (large arrows). Bar, 80 μm. (D) In situ hybridization of SARS genomic sequence of the lung from a SARS victim who died 35 d after the initial symptoms showed macrophages (large arrows) in an alveolus, and many pulmonary epithelial cells (small arrows) contained the virus. Bar, 100 μm. (E) Blood vessel in SARS lung—double labeling, immunohistochemistry of CD68—brown (thin arrows). In situ hybridization of SARS viral sequence—black (thick arrows). A mixed color (arrowheads) indicates that monocyte was infected by SARS virus. The black color also may overshadow the brown color when both are present in the same blood cells and the in situ hybridization signal is very strong. Bar, 100 μm. (F) Negative control for in situ hybridization of SARS genomic sequence of the lung. No positive signal was detected. Bar, 100 μm. (G) EM in situ hybridization with colloidal gold labeling (10 nm gold; arrows) of viral sequence demonstrated that type II epithelial cells of the lung contained the virus. Bar, 0.2 μm. (H) EM image of a portion of an epithelial cell in the lung of a patient who had SARS. The region indicated by the arrow is enlarged in I. Bar, 2 μm. (I) Enlargement of the region in H. A large number of SARS virus–like particles (arrows) was observed. Bar, 0.5 μm. (J) In situ hybridization of SARS viral sequence demonstrated that most of the ciliated epithelial cells (arrows) of the trachea from a patient who had SARS were infected by the virus. Bar, 50 μm. (K) Negative control for in situ hybridization of SARS genomic sequence of the trachea from a patient who had SARS. No positive signal was detected. Bar, 50 μm.
Figure 2.
Figure 2.
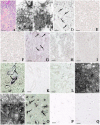
SARS pathology in the immune system. (A) EM image of a circulating T lymphocyte in a patient who had SARS 6 d after onset of fever. Bar, 2 μm. Inset: A higher power view of the region in panel A. A group of SARS coronavirus-like particles was located in the cytoplasm. Bar, 0.2 μm. (B) EM image of the cytoplasm of a lymphocyte showing three coronavirus-like particles (arrows) in the cytoplasm. The lower two are located near the cell membrane. The one on the lower left seems to have just trespassed the membrane and entered the lymphocyte. Bar, 0.5 μm. Inset: A higher power EM image of the membrane region of a peripheral lymphocyte. A coronavirus-like particle (arrow) is shown entering the target cell, and the cell membrane still fused with the viral envelope. E, extracellular space. Bar, 0.1 μm. Similar SARS coronavirus-like particles were not detected in the lymphocytes of non-SARS patient (not depicted). (C) LM hematoxylin and eosin staining of the spleen from a patient who had SARS showing depletion of periarterial lymphatic sheath and dilation of splenic sinusoid. No splenic corpuscle was preserved. Bar, 200 μm. (D) LM immunohistochemistry staining of the spleen from a misdiagnosed patient shows the normal distribution and size of CD68+ macrophages. Bar, 20 μm. (E) LM immunohistochemistry staining of the spleen from a patient who had confirmed SARS shows that CD68+ macrophages are larger than those in the misdiagnosed case. Bar, 20 μm. (F) Negative control for immunohistochemistry staining of the spleen from a patient who had confirmed SARS in which PBS was substituted for the anti-CD68 antibody. No positive signal was detected. Bar, 20 μm. (G) In situ hybridization detected SARS genomic sequence positive lymphocytes (arrows) in the spleen from a SARS autopsy. Bar, 70 μm. (H) In situ hybridization detected SARS genomic sequence positive lymphocytes (arrows) in a lymph node from the hilus of the lung of a SARS autopsy. Bar, 70 μm. (I) Negative control for in situ hybridization of SARS genomic sequence of the lymphocytes in the spleen from a SARS autopsy, in which an unrelated probe was used. No positive signal was detected. Bar, 100 μm. (J) In situ hybridization detected SARS genomic sequence positive lymphocytes in the vessel of thyroid gland from a SARS autopsy. Bar, 70 μm. (K) Negative control for in situ hybridization of SARS genomic sequence, in which the specific probe was substituted by an unrelated probe, of the lymphocytes in thyroid gland of a SARS autopsy. No positive signal was detected. Bar, 70 μm. (L) Spleen of a 51-yr-old male patient who had SARS. The spleen was atrophic with a wrinkled capsule. The texture was very soft. LM revealed marked depletion of the lymphoid population in the spleen. (M) In situ hybridization detected SARS genomic sequence positive lymphocytes (arrows) in a lymph node dissected from the mesentery of a SARS autopsy. Bar, 50 μm.
Figure 3.
Figure 3.
SARS pathology in the gut, kidney, and brain. (A) Depletion of mucosal lymphoid tissue of the small intestine of a patient who had SARS, showing decreased number of lymphocytes and depletion of germinal center. Bar, 200 μm. (B) EM image of a portion of mucosal cell in the small intestine of a SARS autopsy. M, microvilli; N, nucleus. The area indicated by the white arrow is enlarged in C. Bar, 2 μm. (C) Higher magnification of a SARS virus–containing vesicle (white arrow) in the same cell as shown in B. Bar, 0.2 μm. (D) In situ hybridization detected SARS sequence positive signal (arrows) in the cytoplasm of lymphocytes in the submucosal lymphoid tissue. Bar, 30 μm. (E) Negative control for in situ hybridization of SARS genomic sequence of the lymphocytes in the submucosal lymphoid tissue, in which an unrelated probe was used. No positive signal was detected. Bar, 30 μm. (F) In situ hybridization of SARS genomic sequence of lymphocytes in the submucosal lymphoid tissue of a patient who did not have SARS. No positive signal was detected. Bar, 30 μm. (G) In situ hybridization showing SARS-CoV positive signals (arrows) in the cytoplasm of a few mucosal epithelial cells in the small intestine of a patient who had SARS. Bar, 100 μm. (H) Negative control for in situ hybridization of SARS genomic sequence of mucosal epithelial cells in the small intestine of a patient who had SARS, in which an unrelated probe was used. No positive signal was detected. Bar, 100 μm. (I) In situ hybridization of SARS genomic sequence of mucosal epithelial cells in the small intestine of a patient who did not have SARS. No positive signal was detected. Bar, 100 μm. (J) In situ hybridization detected SARS genomic sequence in the tubular epithelium (arrows) of the distal tubules of the kidney of a patient who had SARS. Bar, 70 μm. (K) Negative control for in situ hybridization of SARS genomic sequence of the distal tubules of the kidney of a patient who had SARS, in which an unrelated probe was used. No positive signal was detected. Bar, 70 μm. (L) In situ hybridization of SARS genomic sequence of the distal tubules of the kidney of a patient who did not have SARS. No positive signal was detected. Bar, 70 μm. (M) EM image of the cytoplasm of a tubular epithelial cell in the kidney of a patient who had SARS. The area indicated by the arrow is enlarged in N. M, microvilli of a tubular epithelial cell. Bar, 1 μm. (N) Enlargement of M. EM image of clusters of SARS virus–like particles (arrows) were detected in the cell. Bar, 0.2 μm. (O) In situ hybridization detected SARS genomic sequence in the cytoplasm of numerous neurons (arrows) in the brain of a patient who had SARS. Bar, 100 μm. (P) Negative control for in situ hybridization of SARS genomic sequence of neurons in the brain of a patient who had SARS in which the specific probe was not used. No positive signal was detected. Bar, 100 μm. (Q) In situ hybridization of SARS genomic sequence of neurons in the brain of a patient who did not have SARS. No positive signal was detected. Bar, 100 μm.
Figure 4.
Figure 4.
Lymphocyte subtypes in patients who had confirmed or misdiagnosed SARS. (A–C) The cell counts of CD3, CD4 and CD8, respectively, at various time points after the onset of symptoms in patients who were not treated with glucocorticoids. The data indicate that the lymphocytes were decreased from the onset of the disease in patients who had SARS but not in patients who did not have SARS (confirmed SARS, n = 15; misdiagnosed cases, n = 15). D, E, and F show the cell counts of CD3, CD4, and CD8, respectively, in patients who had confirmed or misdiagnosed SARS at various time points after the onset of symptoms and who were treated with glucocorticoids (confirmed SARS, n = 50; misdiagnosed cases, n = 20). The lymphocytes were decreased in both groups. However, the differences in the two groups with regard to the extent of lymphocyte reduction remained the same. The results from the retrospective investigation suggest that lymphopenia is a characteristic feature of SARS, and implicates an early and consistent destruction of lymphocytes.

Similar articles

Cited by

References

    1. Peiris, J.S., K.Y. Yuen, A.D. Osterhaus, and K. Stohr. 2003. The severe acute respiratory syndrome. N. Engl. J. Med. 349:2431–2441. - PubMed
    1. World Health Organization. Communicable Disease Surveillance & Response (CSR). Severe Acute Respiratory Syndrome (SARS). Available at: http://www.who.int/csr/sars/en (accessed July 11, 2005).
    1. To, K.F., J.H. Tong, P.K. Chan, F.W. Au, S.S. Chim, K.C. Chan, J.L. Cheung, E.Y. Liu, G.M. Tse, A.W. Lo, et al. 2004. Tissue and cellular tropism of the coronavirus associated with severe acute respiratory syndrome: an in-situ hybridization study of fatal cases. J. Pathol. 202:157–163. - PMC - PubMed
    1. Peiris, J.S., S.T. Lai, L.L. Poon, Y. Guan, L.Y. Yam, W. Lim, J. Nicholls, W.K. Yee, W.W. Yan, M.T. Cheung, et al. 2003. Coronavirus as a possible cause of severe acute respiratory syndrome. Lancet. 361:1319–1325. - PMC - PubMed
    1. Chan-Yeung, M., and W.C. Yu. 2003. Outbreak of severe acute respiratory syndrome in Hong Kong Special Administrative Region: case report. BMJ. 326:850–852. - PMC - PubMed

Publication types

MeSH terms