GObar: a gene ontology based analysis and visualization tool for gene sets
- PMID: 16042800
- PMCID: PMC1190157
- DOI: 10.1186/1471-2105-6-189
GObar: a gene ontology based analysis and visualization tool for gene sets
Abstract
Background: Microarray experiments, as well as other genomic analyses, often result in large gene sets containing up to several hundred genes. The biological significance of such sets of genes is, usually, not readily apparent. Identification of the functions of the genes in the set can help highlight features of interest. The Gene Ontology Consortium 1 has annotated genes in several model organisms using a controlled vocabulary of terms and placed the terms on a Gene Ontology (GO), which comprises three disjoint hierarchies for Molecular functions, Biological processes and Cellular locations. The annotations can be used to identify functions that are enriched in the set, but this analysis can be misleading since the underlying distribution of genes among various functions is not uniform. For example, a large number of genes in a set might be kinases just because the genome contains many kinases.
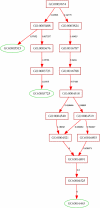
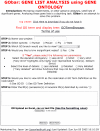
Results: We use the Gene Ontology hierarchy and the annotations to pick significant functions and pathways by comparing the distribution of functions in a given gene list against the distribution of all the genes in the genome, using the hypergeometric distribution to assign probabilities. GObar is a web-based visualizer that implements this algorithm. The public website for GObar 2 can analyse gene lists from the yeast (S. cervisiae), fly (D. Melanogaster), mouse (M. musculus) and human (H. sapiens) genomes. It also allows visualization of the GO tree, as well as placement of a single gene on the GO hierarchy. We analyse a gene list from a genomic study of pre-mRNA splicing to demonstrate the utility of GObar.
Conclusion: GObar is freely available as a web-based tool at http://katahdin.cshl.org:9331/GO2 and can help analyze and visualize gene lists from genomic analyses.
Figures


Similar articles
-
GO::TermFinder--open source software for accessing Gene Ontology information and finding significantly enriched Gene Ontology terms associated with a list of genes.Bioinformatics. 2004 Dec 12;20(18):3710-5. doi: 10.1093/bioinformatics/bth456. Epub 2004 Aug 5. Bioinformatics. 2004. PMID: 15297299 Free PMC article.
-
DynGO: a tool for visualizing and mining of Gene Ontology and its associations.BMC Bioinformatics. 2005 Aug 9;6:201. doi: 10.1186/1471-2105-6-201. BMC Bioinformatics. 2005. PMID: 16091147 Free PMC article.
-
GOTrapper: a tool to navigate through branches of gene ontology hierarchy.BMC Bioinformatics. 2019 Jan 11;20(1):20. doi: 10.1186/s12859-018-2581-8. BMC Bioinformatics. 2019. PMID: 30634902 Free PMC article.
-
Visual annotation display (VLAD): a tool for finding functional themes in lists of genes.Mamm Genome. 2015 Oct;26(9-10):567-73. doi: 10.1007/s00335-015-9570-2. Epub 2015 Jun 6. Mamm Genome. 2015. PMID: 26047590 Free PMC article.
-
MILANO--custom annotation of microarray results using automatic literature searches.BMC Bioinformatics. 2005 Jan 20;6:12. doi: 10.1186/1471-2105-6-12. BMC Bioinformatics. 2005. PMID: 15661078 Free PMC article.
Cited by
-
Transcriptome-wide Mendelian randomization during CD4+ T cell activation reveals immune-related drug targets for cardiometabolic diseases.Nat Commun. 2024 Oct 28;15(1):9302. doi: 10.1038/s41467-024-53621-7. Nat Commun. 2024. PMID: 39468075 Free PMC article.
-
BACA: bubble chArt to compare annotations.BMC Bioinformatics. 2015 Feb 5;16(1):37. doi: 10.1186/s12859-015-0477-4. BMC Bioinformatics. 2015. PMID: 25652236 Free PMC article.
-
Rank-rank hypergeometric overlap: identification of statistically significant overlap between gene-expression signatures.Nucleic Acids Res. 2010 Sep;38(17):e169. doi: 10.1093/nar/gkq636. Epub 2010 Jul 21. Nucleic Acids Res. 2010. PMID: 20660011 Free PMC article.
-
Molecular profiling of experimental endometriosis identified gene expression patterns in common with human disease.Fertil Steril. 2007 May;87(5):1180-99. doi: 10.1016/j.fertnstert.2006.07.1550. Fertil Steril. 2007. PMID: 17478174 Free PMC article.
-
Bioinformatics enrichment tools: paths toward the comprehensive functional analysis of large gene lists.Nucleic Acids Res. 2009 Jan;37(1):1-13. doi: 10.1093/nar/gkn923. Epub 2008 Nov 25. Nucleic Acids Res. 2009. PMID: 19033363 Free PMC article.
References
-
- Gene Ontology Consortium website http://www.geneontology.org
-
- GObar website http://katahdin.cshl.org:9331/GO
-
- Smith B, Williams J, Schulze-Kremer S. The Ontology of Gene Ontology. Proceedings of AMIA Symposium. 2003. http://ontology.buffalo.edu/medo/Gene_Ontology.pdf - PMC - PubMed
-
- Gene E. Entrez Gene: unified query environment for genes http://www.ncbi.nlm.nih.gov/entrez/query.fcgi?db=gene
-
- FlyBase FlyBase: A database of the drosophila genome http://www.flybase.org/
Publication types
MeSH terms
LinkOut - more resources
Full Text Sources
Molecular Biology Databases

