. 2005 Jul 18;202(2):261-9.
doi: 10.1084/jem.20050678. Epub 2005 Jul 11.

Aberrant T cell differentiation in the absence of Dicer

Affiliations

Aberrant T cell differentiation in the absence of Dicer

Stefan A Muljo et al. J Exp Med. .

Abstract

Dicer is an RNaseIII-like enzyme that is required for generating short interfering RNAs and microRNAs. The latter have been implicated in regulating cell fate determination in invertebrates and vertebrates. To test the requirement for Dicer in cell-lineage decisions in a mammalian organism, we have generated a conditional allele of dicer-1 (dcr-1) in the mouse. Specific deletion of dcr-1 in the T cell lineage resulted in impaired T cell development and aberrant T helper cell differentiation and cytokine production. A severe block in peripheral CD8(+) T cell development was observed upon dcr-1 deletion in the thymus. However, Dicer-deficient CD4(+) T cells, although reduced in numbers, were viable and could be analyzed further. These cells were defective in microRNA processing, and upon stimulation they proliferated poorly and underwent increased apoptosis. Independent of their proliferation defect, Dicer-deficient helper T cells preferentially expressed interferon-gamma, the hallmark effector cytokine of the Th1 lineage.


Figures
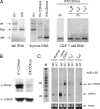
Figure 1.
Figure 1.
Conditional gene targeting of mouse dcr-1. (A) Southern blot of BglI-digested genomic DNA isolated from the tail of a dcr fl/+;CD4cre and dcr fl/fl;CD4cre mouse hybridized to radiolabeled 5′ probe; CD4+-enriched thymocytes from a dcr-1 heterozygous mouse (fl/+;CD4cre) and a homozygous (fl/fl;CD4cre) littermate; CD4+-enriched peripheral T cells from a dcr fl/fl;CD4cre mouse freshly isolated (d0) or cultured for 5 d (d5) under nonpolarizing (THN), Th1 (TH1), or Th2 (TH2) conditions. (B) Western blot of whole-cell protein extracts derived from CD4+-enriched peripheral T cells (pooled from spleen and lymph nodes) of a heterozygous control (fl/+;CD4cre) and a homozygous (fl/fl;CD4cre) mouse. The Western blot was probed for Dicer protein using antiserum raised against a peptide of Dicer (top), and then stripped and reprobed for tubulin (bottom). (C) Northern analysis of miRNA expression in mouse T cells. Total RNA from WT (dcr fl/+;CD4cre) and KO (dcr fl/fl;CD4cre) T cells were resolved on a denaturing polyacrylamide gel and transferred onto a nylon membrane. Samples include unfractionated thymocytes, CD4+-enriched naive peripheral T cells, and Th1 (TH1) and Th2 (TH2) cultures (d 5). Shown is the PhosphorImage of a blot hybridized to a radiolabeled oligonucleotide complementary to mature miR-150. To control for equal RNA loading, a segment of the ethidium bromide–stained gel showing the transfer RNA (tRNA) bands is included (bottom panel). The arrows indicate processed mature miRNA, pre-miRNA, and tRNA. A radiolabeled Decade marker (M) consisting of 20, 30, 40, 50, 60, 70, 80, 90, 100, 150 nucleotide RNA size markers is included.
Figure 2.
Figure 2.
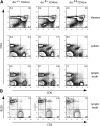
Reduction of the mature T cell compartment in the absence of Dicer. Flow cytometric analysis of lymphocytes from dcr fl/+;CD4cre (left column) and dcr fl/fl;CD4cre littermates (right column). (A) Contour plots depict CD4 (y-axis) versus CD8 (x-axis) staining profiles in thymus (top panels), spleen (middle panels), and lymph nodes (bottom panels). Percentages of double-negative (DN), DP, and SP cells are indicated in the corner of each quadrant. When the data are available, the average ± SD is shown for certain subsets (n = 4, except for lymph nodes, where n = 3). (B) Contour plots depict B220 (y-axis) versus CD3 (x-axis) staining profiles in lymph nodes. Percentages of cells in each quadrant are indicated. Data are representative of three independent experiments.
Figure 3.
Figure 3.
Counterselection of Dicer-deficient T cells. Flow cytometric analysis of lymphocytes from dcr fl/+;CD4cre;R26R-YFP (left), and dcr fl/fl;CD4cre;R26R-YFP littermates (right). Dot plots depict CD8 (y-axis) versus CD4 (x-axis) staining profiles in (A) thymus and (B) spleen. Percentages of DN, DP, and SP cells are indicated beside each gate. Histograms depict relative cell number (y-axis) versus Cre-induced YFP fluorescence (x-axis) within the DN, DP, and SP thymocyte fractions (C), or SP splenocyte fractions (D). Percentages of YFP-expressing cells are indicated.
Figure 4.
Figure 4.
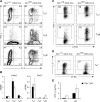
Decreased proliferation and increased apoptosis of Dicer-deficient T cells. (A) Expansion of T cell populations expressed as fold increase from seeding number at day 0 to live cell number at day 4 of culture in Th1 (TH1) or Th2 (TH2) conditions. Purified spleen and lymph node CD4+ T cells from control (CTRL, dcr fl/+, dcr fl/+;CD4cre or dcr +/+;CD4cre) or KO (dcr fl/fl;CD4cre) mice were stimulated with plate-bound anti-CD3 and anti-CD28 for 2 d and then cultured in IL-2–containing medium for another 2 d (ThN condition). Th1 cultures also contain IL-12 and anti–IL-4 blocking antibody. Th2 cultures contain exogenous IL-4, anti–IL-12, and anti-IFNγ. Averages of three independent experiments ± SD are shown). (B) AnnexinV staining of apoptotic T cells after culture for the indicated times in ThN conditions as described in (A). Percentages of apoptotic (AnnexinV+ PI) and dead (AnnexinV+ PI+) cells in control (CTRL, left) versus KO (right panels) mice are indicated within the quadrants. (C) Fluorescence profile of control (CTRL, black histogram) or KO (gray histogram) T cells labeled with CFSE at d 0 and cultured for the indicated times in ThN conditions as described in (A). Cell divisions can be visualized by serial twofold dilution of CFSE in daughter cells. Data are representative of three independent experiments. (D) ELISA analysis of secreted IL-2 in culture supernatants of dcr fl/+;CD4cre (open squares) versus dcr fl/fl;CD4cre (gray squares) T cells stimulated with plate-bound anti-CD3 and anti-CD28 for the indicated times. Averages of triplicate cultures ± SD are shown.
Figure 5.
Figure 5.
Helper T cell differentiation in the absence of Dicer. (A) Intracellular FACS analysis of IL-4 (x-axis) and IFNγ (y-axis) expression by cells cultured under Th1 (top), Th2 (middle), or ThN (bottom panels) conditions for 5 d, and then restimulated with phorbol ester (phorbol 12-myristate 13-acetate) and ionomycin. Percentages of cells in each quadrant are indicated. Data are representative of three independent experiments. (B) In one experiment, the abundance of the real-time fluorogenic RT-PCR reactions were normalized to Hprt1 mRNA abundance. Indicated mRNAs (Gata3, Tbx21) were measured in cells cultured as in A but left unstimulated. Data are presented as the average relative abundance ± SD for triplicate reactions, and are representative of two independent experiments. (C and D) CD4+ T cells were labeled with CFSE (x-axis), stimulated for 47 h under Th1 or ThN conditions, “rested” in IL-2–containing medium for 7 h, and restimulated for intracellular FACS analysis of IFNγ (C) and IL-2 (D) expression (y-axis). The percentage of cytokine-expressing cells is indicated in each box. (E) ELISA analysis of secreted IFNγ in culture supernatants of dcr fl/+;CD4cre (CTRL, black columns) and dcr fl/fl;CD4cre (KO, open columns) T cells stimulated with plate-bound anti-CD3 and anti-CD28 for the indicated times. Averages of triplicate cultures ± SD are shown.
Figure 6.
Figure 6.
Defective IFNγ repression in Dicer-deficient Th2 cultures. CD4+ T cells were cultured under Th2 conditions for 5 d, and the resulting cells were stimulated again with anti-CD3 and anti-CD28 and cultured for an additional 5 d under Th2 conditions (Th2→Th2, top) or Th1 conditions (Th2→Th1, bottom panels). IL-4 and IFNγ expression was analyzed by intracellular FACS after restimulation with phorbol ester and ionomycin. The percentage of cytokine-expressing cells is indicated in each quadrant.

Similar articles

Cited by

References

    1. Mello, C.C., and D. Conte Jr. 2004. Revealing the world of RNA interference. Nature. 431:338–342. - PubMed
    1. Ambros, V. 2004. The functions of animal microRNAs. Nature. 431:350–355. - PubMed
    1. Lippman, Z., and R. Martienssen. 2004. The role of RNA interference in heterochromatic silencing. Nature. 431:364–370. - PubMed
    1. Meister, G., and T. Tuschl. 2004. Mechanisms of gene silencing by double-stranded RNA. Nature. 431:343–349. - PubMed
    1. Bartel, D.P. 2004. MicroRNAs: genomics, biogenesis, mechanism, and function. Cell. 116:281–297. - PubMed

Publication types

MeSH terms