An autosomal dominant cerebellar ataxia linked to chromosome 16q22.1 is associated with a single-nucleotide substitution in the 5' untranslated region of the gene encoding a protein with spectrin repeat and Rho guanine-nucleotide exchange-factor domains
- PMID: 16001362
- PMCID: PMC1224530
- DOI: 10.1086/432518
An autosomal dominant cerebellar ataxia linked to chromosome 16q22.1 is associated with a single-nucleotide substitution in the 5' untranslated region of the gene encoding a protein with spectrin repeat and Rho guanine-nucleotide exchange-factor domains
Abstract
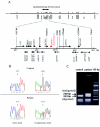
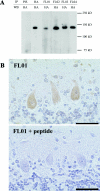
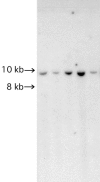
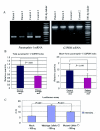
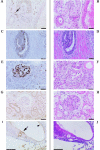
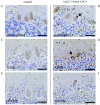
Autosomal dominant cerebellar ataxia (ADCA) is a group of heterogeneous neurodegenerative disorders. By positional cloning, we have identified the gene strongly associated with a form of degenerative ataxia (chromosome 16q22.1-linked ADCA) that clinically shows progressive pure cerebellar ataxia. Detailed examination by use of audiogram suggested that sensorineural hearing impairment may be associated with ataxia in our families. After restricting the candidate region in chromosome 16q22.1 by haplotype analysis, we found that all patients from 52 unrelated Japanese families harbor a heterozygous C-->T single-nucleotide substitution, 16 nt upstream of the putative translation initiation site of the gene for a hypothetical protein DKFZP434I216, which we have called "puratrophin-1" (Purkinje cell atrophy associated protein-1). The full-length puratrophin-1 mRNA had an open reading frame of 3,576 nt, predicted to contain important domains, including the spectrin repeat and the guanine-nucleotide exchange factor (GEF) for Rho GTPases, followed by the Dbl-homologous domain, which indicates the role of puratrophin-1 in intracellular signaling and actin dynamics at the Golgi apparatus. Puratrophin-1--normally expressed in a wide range of cells, including epithelial hair cells in the cochlea--was aggregated in Purkinje cells of the chromosome 16q22.1-linked ADCA brains. Consistent with the protein prediction data of puratrophin-1, the Golgi-apparatus membrane protein and spectrin also formed aggregates in Purkinje cells. The present study highlights the importance of the 5' untranslated region (UTR) in identification of genes of human disease, suggests that a single-nucleotide substitution in the 5' UTR could be associated with protein aggregation, and indicates that the GEF protein is associated with cerebellar degeneration in humans.
Figures



Similar articles
-
A -16C>T substitution in the 5' UTR of the puratrophin-1 gene is prevalent in autosomal dominant cerebellar ataxia in Nagano.J Hum Genet. 2006;51(5):461-466. doi: 10.1007/s10038-006-0385-6. Epub 2006 Apr 14. J Hum Genet. 2006. PMID: 16614795
-
16q-linked autosomal dominant cerebellar ataxia: a clinical and genetic study.J Neurol Sci. 2006 Sep 25;247(2):180-6. doi: 10.1016/j.jns.2006.04.009. Epub 2006 Jun 15. J Neurol Sci. 2006. PMID: 16780885
-
Redefining the disease locus of 16q22.1-linked autosomal dominant cerebellar ataxia.J Hum Genet. 2007;52(8):643-649. doi: 10.1007/s10038-007-0154-1. Epub 2007 Jul 5. J Hum Genet. 2007. PMID: 17611710
-
[Molecular genetic approach to spinocerebellar ataxias].Rinsho Shinkeigaku. 2009 Nov;49(11):907-9. doi: 10.5692/clinicalneurol.49.907. Rinsho Shinkeigaku. 2009. PMID: 20030245 Review. Japanese.
-
[Spinocerebellar ataxia type 31].Rinsho Shinkeigaku. 2010 Nov;50(11):985-7. doi: 10.5692/clinicalneurol.50.985. Rinsho Shinkeigaku. 2010. PMID: 21921537 Review. Japanese.
Cited by
-
Mutations in the KIAA0196 gene at the SPG8 locus cause hereditary spastic paraplegia.Am J Hum Genet. 2007 Jan;80(1):152-61. doi: 10.1086/510782. Epub 2006 Dec 1. Am J Hum Genet. 2007. PMID: 17160902 Free PMC article.
-
Spinocerebellar ataxia 17 (SCA17) and Huntington's disease-like 4 (HDL4).Cerebellum. 2008;7(2):170-8. doi: 10.1007/s12311-008-0016-1. Cerebellum. 2008. PMID: 18418687
-
Peripheral neuropathy in chromosome16q22.1 linked autosomal dominant cerebellar ataxia.J Neurol Neurosurg Psychiatry. 2007 Sep;78(9):1009-11. doi: 10.1136/jnnp.2006.103895. J Neurol Neurosurg Psychiatry. 2007. PMID: 17702787 Free PMC article. No abstract available.
-
Tyrosine phosphorylation of Dbl regulates GTPase signaling.J Biol Chem. 2014 Jun 13;289(24):17195-202. doi: 10.1074/jbc.M114.573782. Epub 2014 Apr 28. J Biol Chem. 2014. PMID: 24778185 Free PMC article.
-
Midbrain atrophy related to parkinsonism in a non-coding repeat expansion disorder: five cases of spinocerebellar ataxia type 31 with nigrostriatal dopaminergic dysfunction.Cerebellum Ataxias. 2021 Mar 30;8(1):11. doi: 10.1186/s40673-021-00134-4. Cerebellum Ataxias. 2021. PMID: 33785066 Free PMC article.
References
Web Resources
-
- Celera Discovery System, http://www.celeradiscoverysystem.com/index.cfm (for candidate genes)
-
- Ensembl, http://www.ensembl.org/ (for genetic map, genomic sequences, ESTs, and 21 candidate genes, including Q9H7K4 and SLC9A5)
-
- GenBank, http://www.ncbi.nlm.nih.gov/Genbank/ (for microsatellite DNA markers GGAA10 [accession number AB13610], TTCC01 [accession number AB13611], TA001 [accession number AB13612], GA001 [accession number AB197662], and AAT01 [accession number AB13613] and full-length and short-form puratrophin-1 mRNAs [accession numbers AB197663 and AB197664])
-
- NCBI, http://www.ncbi.nlm.nih.gov/ (for DKFZP434I216 [accession numbers BC054486 and AK024475])
-
- Online Mendelian Inheritance in Man (OMIM), http://www.ncbi.nlm.nih.gov/Omim/ (for 16q-linked ADCA type III, or SCA4)
References
-
- Bergeron C, Beric-Maskarel K, Muntasser S, Weyer L, Somerville M, Percy ME (1994) Neurofilament light and polyadenylated mRNA levels are decreased in amyotrophic lateral sclerosis motor neurons. J Neuropathol Exp Neurol 53:221–230 - PubMed
-
- Charron AJ, Bacallao RL, Wandinger-Ness A (2000) ADPKD: a human disease altering Golgi function and basolateral exocytosis in renal epithelia. Traffic 1:675–686 - PubMed
-
- Chen D-H, Brkanac Z, Verlinde CLMJ, Tan X-J, Bylenok L, Nochlin D, Matsushita M, Lipe H, Wolff J, Fernandez M, Cimino PJ, Bird TD, Raskind WH (2003) Missense mutations in the regulatory domain of PKCγ: a new mechanism for dominant nonepisodic cerebellar ataxia. Am J Hum Genet 72:839–849 - PMC - PubMed
-
- Estrach S, Schmidt S, Diriong S, Penna A, Blangy A, Fort P, Debant A (2002) The human Rho-GEF trio and its target GTPase RhoG are involved in the NGF pathway, leading to neurite outgrowth. Curr Biol 12:307–312 - PubMed
Publication types
MeSH terms
Substances
LinkOut - more resources
Full Text Sources
Other Literature Sources
Molecular Biology Databases
Research Materials

