

Standardization of cytokine flow cytometry assays
- PMID: 15978127
- PMCID: PMC1184077
- DOI: 10.1186/1471-2172-6-13
Standardization of cytokine flow cytometry assays
Abstract
Background: Cytokine flow cytometry (CFC) or intracellular cytokine staining (ICS) can quantitate antigen-specific T cell responses in settings such as experimental vaccination. Standardization of ICS among laboratories performing vaccine studies would provide a common platform by which to compare the immunogenicity of different vaccine candidates across multiple international organizations conducting clinical trials. As such, a study was carried out among several laboratories involved in HIV clinical trials, to define the inter-lab precision of ICS using various sample types, and using a common protocol for each experiment (see additional files online).
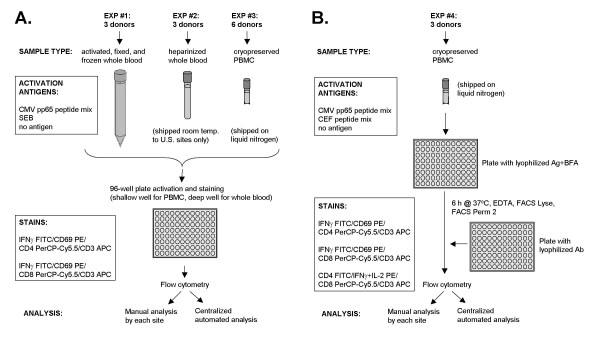
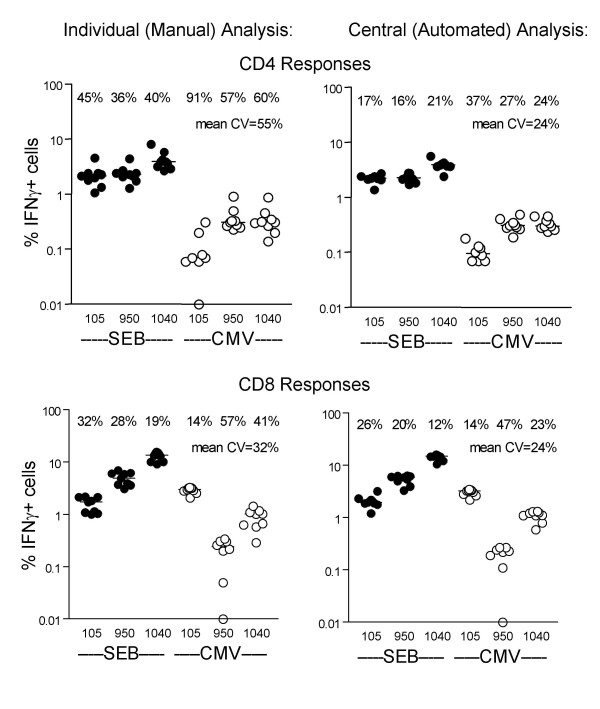
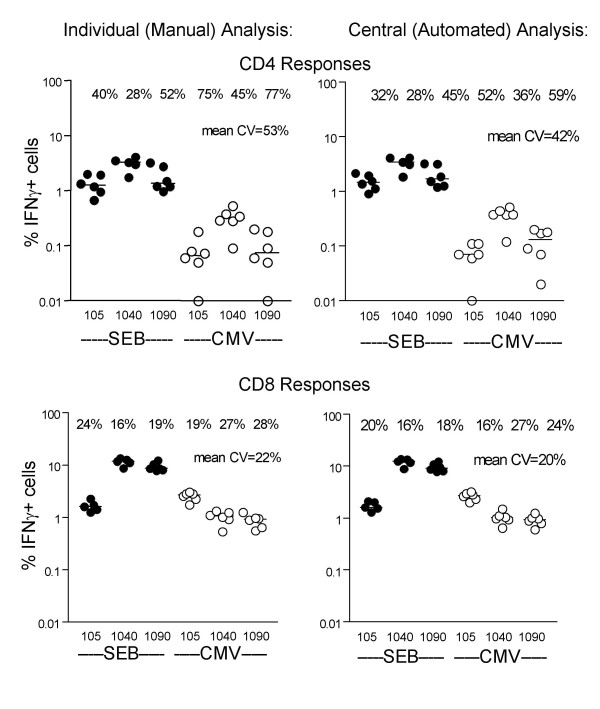
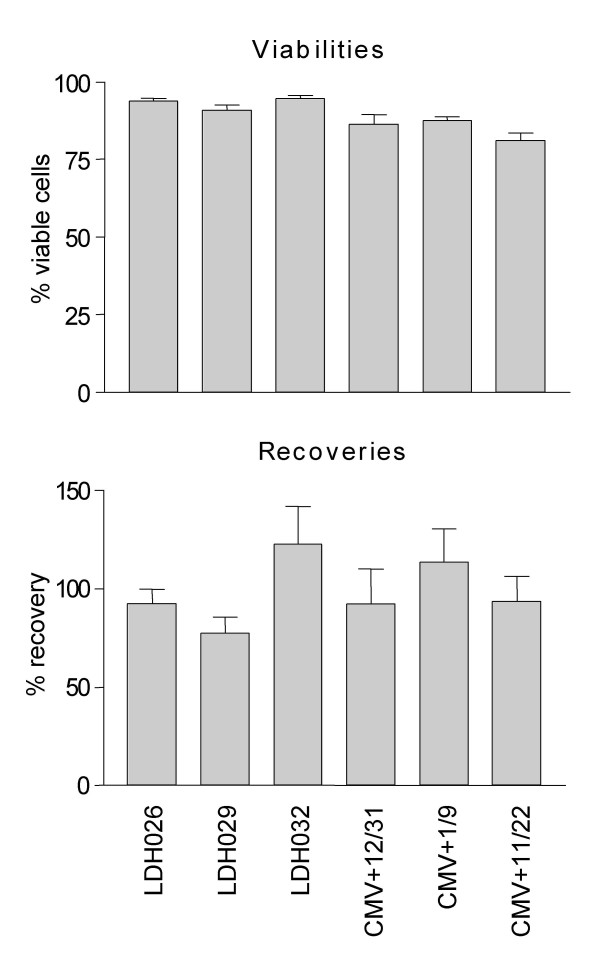
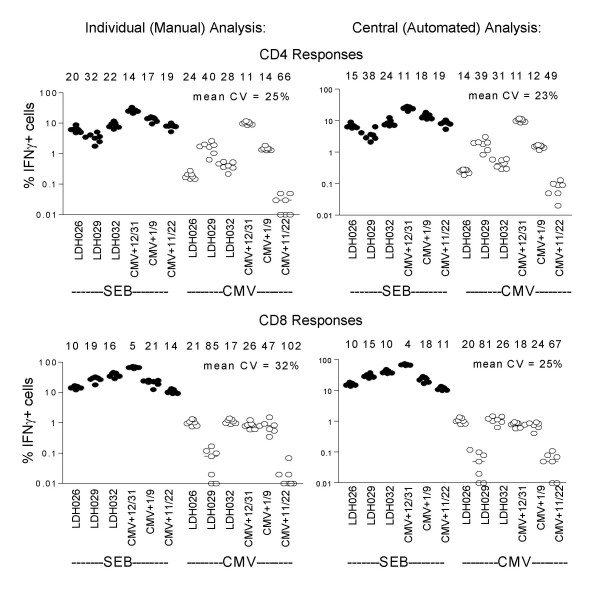
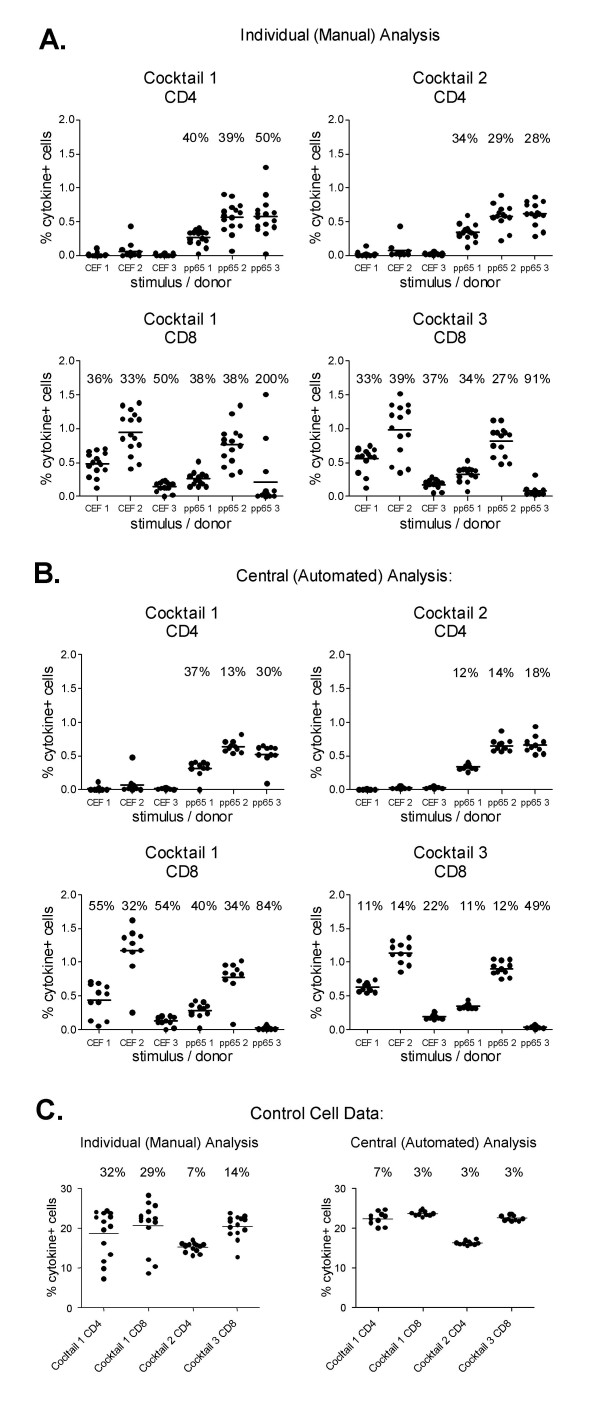
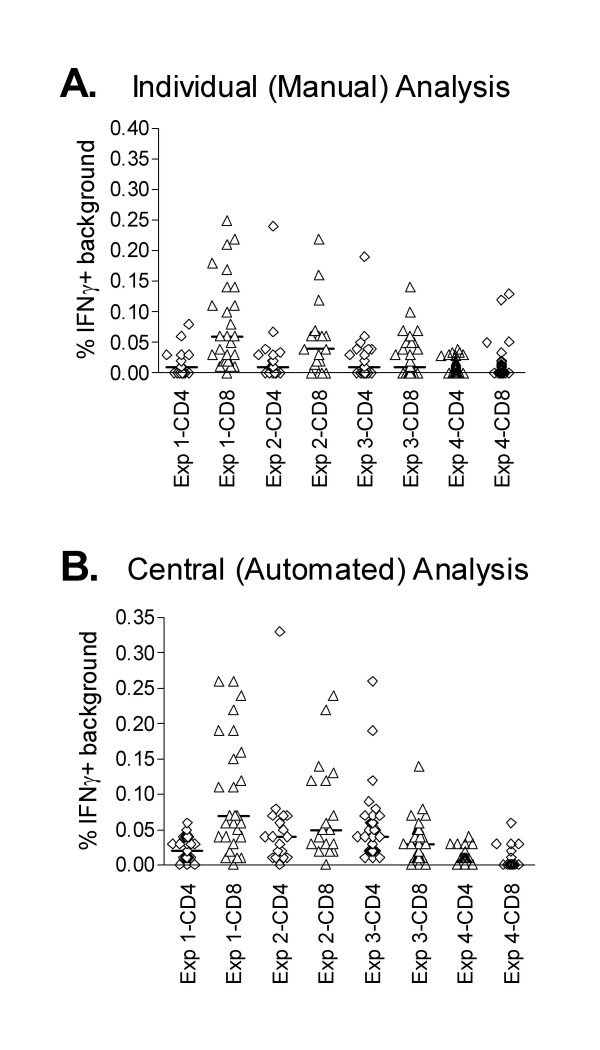
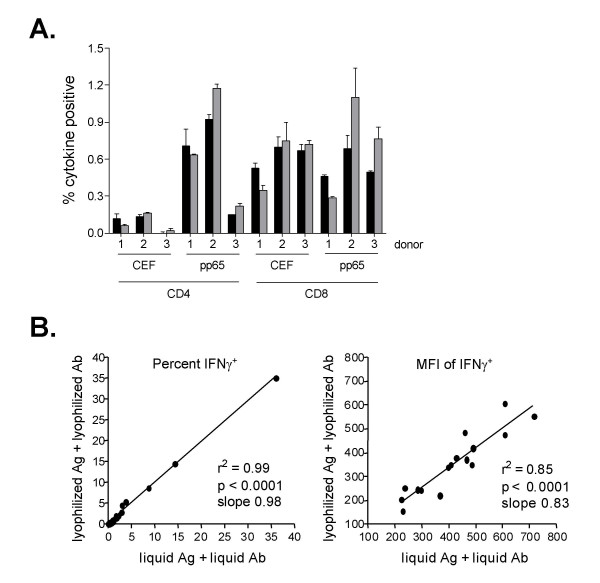
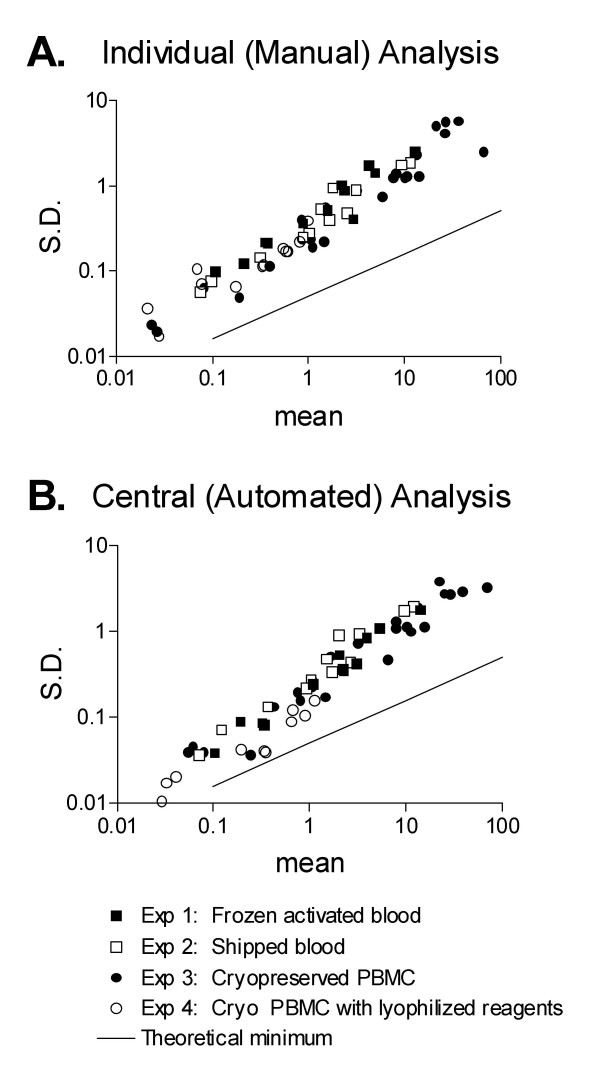
Results: Three sample types (activated, fixed, and frozen whole blood; fresh whole blood; and cryopreserved PBMC) were shipped to various sites, where ICS assays using cytomegalovirus (CMV) pp65 peptide mix or control antigens were performed in parallel in 96-well plates. For one experiment, antigens and antibody cocktails were lyophilised into 96-well plates to simplify and standardize the assay setup. Results ((CD4+)cytokine+ cells and (CD8+)cytokine+ cells) were determined by each site. Raw data were also sent to a central site for batch analysis with a dynamic gating template. Mean inter-laboratory coefficient of variation (C.V.) ranged from 17-44% depending upon the sample type and analysis method. Cryopreserved peripheral blood mononuclear cells (PBMC) yielded lower inter-lab C.V.'s than whole blood. Centralized analysis (using a dynamic gating template) reduced the inter-lab C.V. by 5-20%, depending upon the experiment. The inter-lab C.V. was lowest (18-24%) for samples with a mean of > 0.5% IFNgamma + T cells, and highest (57-82%) for samples with a mean of < 0.1% IFNgamma + cells.
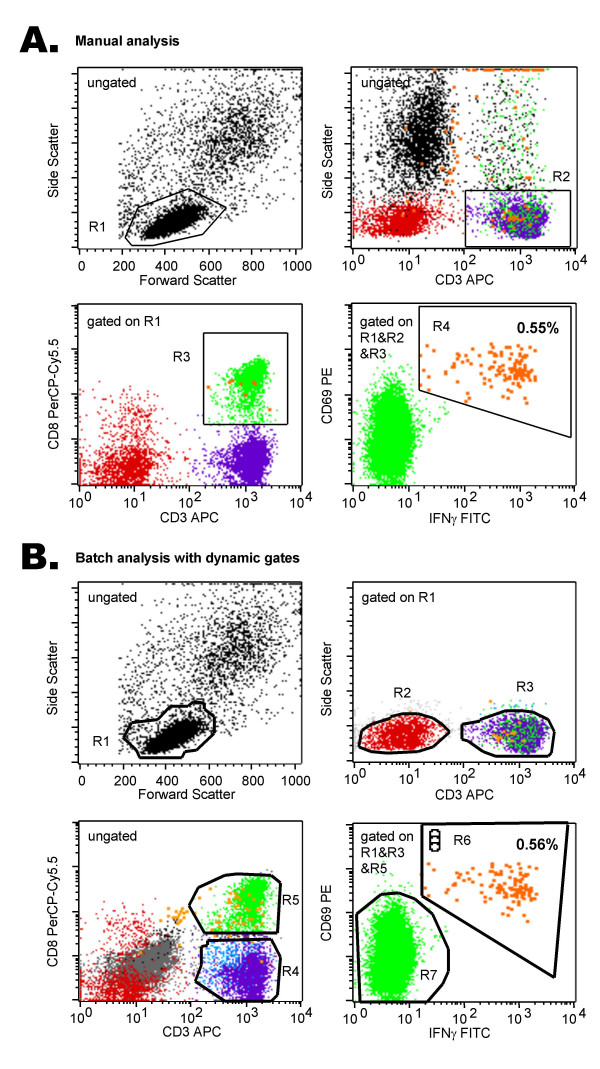
Conclusion: ICS assays can be performed by multiple laboratories using a common protocol with good inter-laboratory precision, which improves as the frequency of responding cells increases. Cryopreserved PBMC may yield slightly more consistent results than shipped whole blood. Analysis, particularly gating, is a significant source of variability, and can be reduced by centralized analysis and/or use of a standardized dynamic gating template. Use of pre-aliquoted lyophilized reagents for stimulation and staining can provide further standardization to these assays.
Figures
Similar articles
-
VACUTAINER CPT and Ficoll density gradient separation perform equivalently in maintaining the quality and function of PBMC from HIV seropositive blood samples.BMC Immunol. 2006 May 25;7:11. doi: 10.1186/1471-2172-7-11. BMC Immunol. 2006. PMID: 16725038 Free PMC article.
-
ELISPOT assays provide reproducible results among different laboratories for T-cell immune monitoring--even in hands of ELISPOT-inexperienced investigators.J Immunotoxicol. 2009 Dec;6(4):227-34. doi: 10.3109/15476910903317546. J Immunotoxicol. 2009. PMID: 19908941
-
Impact of cryopreservation on tetramer, cytokine flow cytometry, and ELISPOT.BMC Immunol. 2005 Jul 18;6:17. doi: 10.1186/1471-2172-6-17. BMC Immunol. 2005. PMID: 16026627 Free PMC article.
-
Cytokine flow cytometry: multiparametric approach to immune function analysis.Cytotherapy. 2003;5(1):1-6. doi: 10.1080/14653240310000029. Cytotherapy. 2003. PMID: 12745590 Review.
-
The role of flow cytometry in the interferon-gamma-based diagnosis of active tuberculosis and its coinfection with HIV-1--A technically oriented review.Cytometry B Clin Cytom. 2008;74 Suppl 1:S141-51. doi: 10.1002/cyto.b.20381. Cytometry B Clin Cytom. 2008. PMID: 18061950 Review.
Cited by
-
VACUTAINER CPT and Ficoll density gradient separation perform equivalently in maintaining the quality and function of PBMC from HIV seropositive blood samples.BMC Immunol. 2006 May 25;7:11. doi: 10.1186/1471-2172-7-11. BMC Immunol. 2006. PMID: 16725038 Free PMC article.
-
Identification of T-Cell Epitopes Using a Combined In-Silico and Experimental Approach in a Mouse Model for SARS-CoV-2.Curr Issues Mol Biol. 2023 Sep 28;45(10):7944-7955. doi: 10.3390/cimb45100502. Curr Issues Mol Biol. 2023. PMID: 37886945 Free PMC article.
-
Precision and linearity targets for validation of an IFNgamma ELISPOT, cytokine flow cytometry, and tetramer assay using CMV peptides.BMC Immunol. 2008 Mar 17;9:9. doi: 10.1186/1471-2172-9-9. BMC Immunol. 2008. PMID: 18366814 Free PMC article.
-
BK virus-specific T-cell immune reconstitution after allogeneic hematopoietic cell transplantation.Blood Adv. 2020 May 12;4(9):1881-1893. doi: 10.1182/bloodadvances.2019001120. Blood Adv. 2020. PMID: 32374880 Free PMC article.
-
Improving Reliability of Immunological Assays by Defining Minimal Criteria for Cell Fitness.Immunohorizons. 2024 Sep 1;8(9):622-634. doi: 10.4049/immunohorizons.2300095. Immunohorizons. 2024. PMID: 39248805 Free PMC article.
References
-
- Maecker HT. Cytokine flow cytometry. In: Hawley TS, Hawley RG, editor. Flow Cytometry Protocols. 2nd. Totowa, NJ , Humana Press; 2004. pp. 95–107. (Meth Molec Biol). Walker J.
-
- Cox JH, Ferrari G, Kalams SA, Lopaczynski W, Oden N, Group ELISPOTS. Results of an ELISPOT proficiency panel conducted in 11 laboratories participating in international human immunodeficiency virus type 1 vaccine trials. AIDS Res Hum Retroviruses. 2005. - PubMed
-
- McMichael AJ, Hanke T. HIV vaccines 1983-2003. Nat Med. 2003;9:874–880. - PubMed
-
- Pantaleo G, Koup RA. Correlates of immune protection in HIV-1 infection: what we know, what we don't know, what we should know. Nat Med. 2004;10:806–810. - PubMed
Publication types
MeSH terms
Substances
LinkOut - more resources
Full Text Sources
Other Literature Sources
Research Materials
Miscellaneous
