. 2005 Aug 15;567(Pt 1):191-213.
doi: 10.1113/jphysiol.2005.089888. Epub 2005 Jun 16.

Characterization of a proton-activated, outwardly rectifying anion channel

Affiliations

Characterization of a proton-activated, outwardly rectifying anion channel

Sachar Lambert et al. J Physiol. .

Abstract

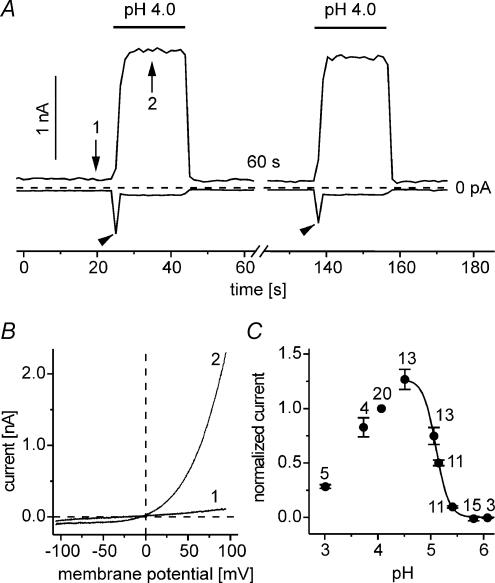
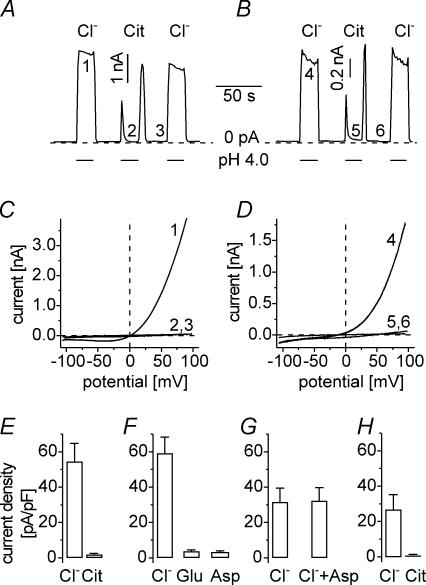
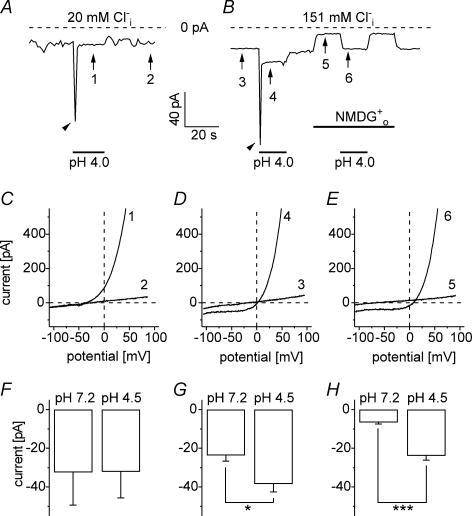
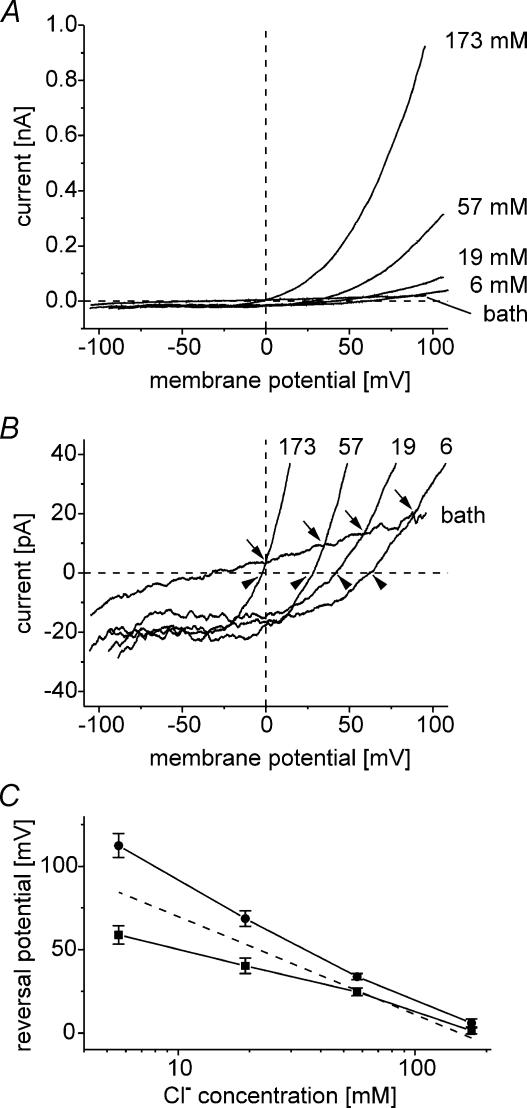
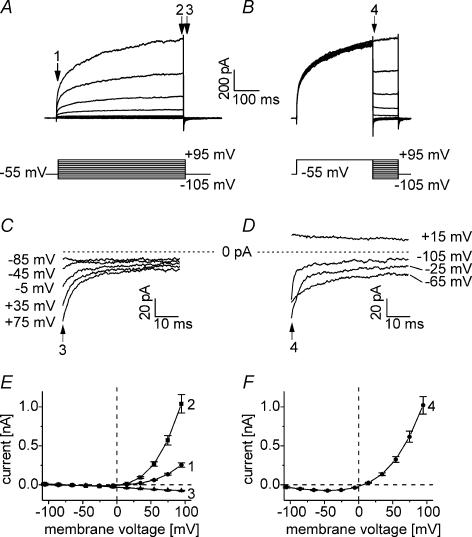
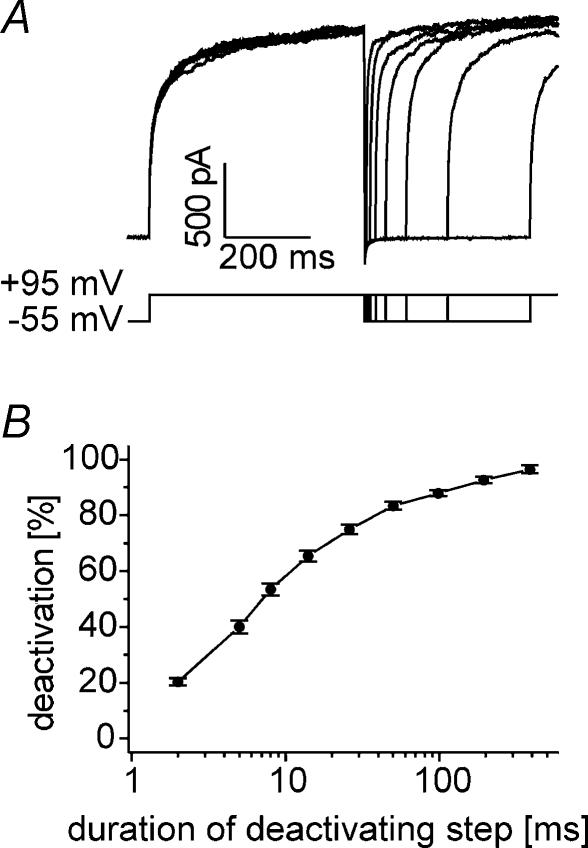
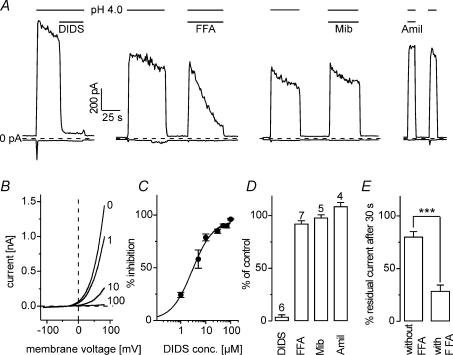
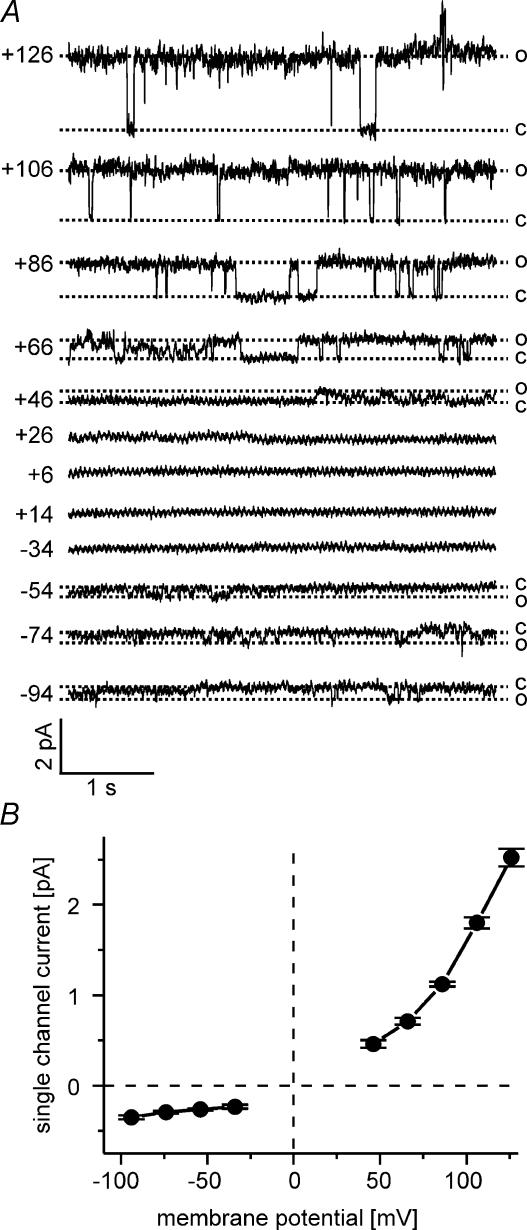
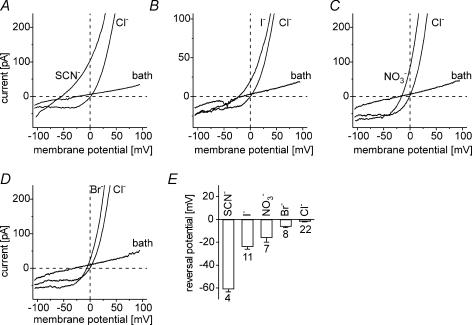
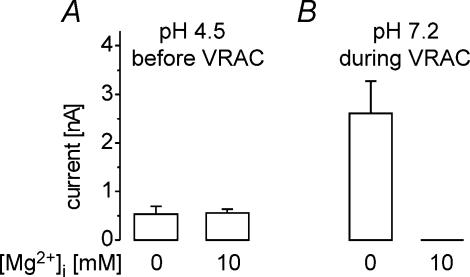
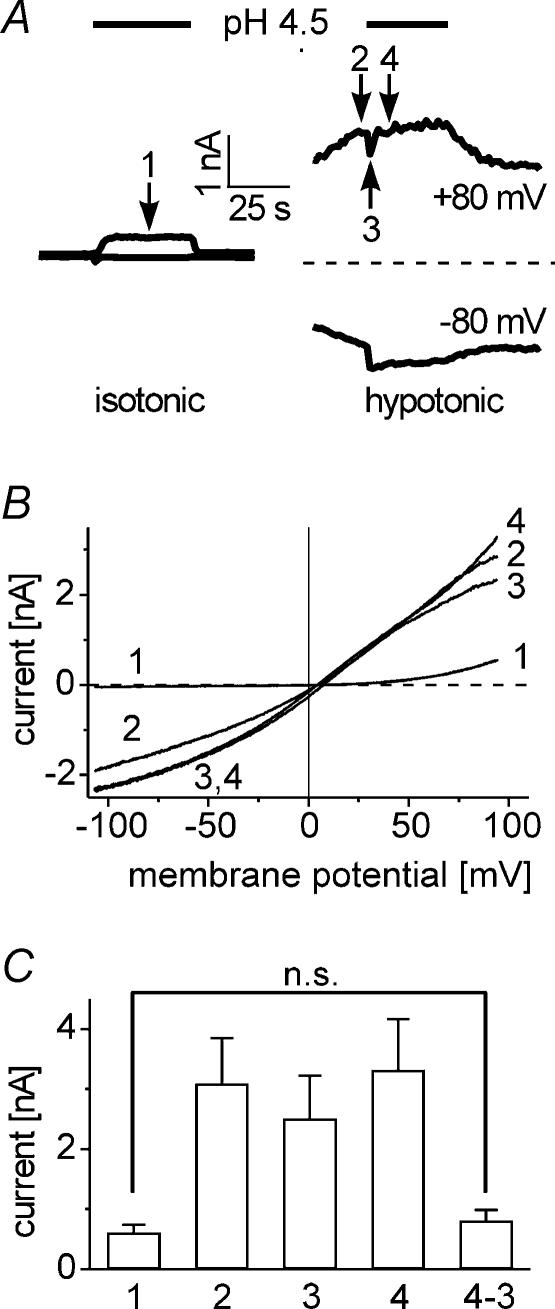
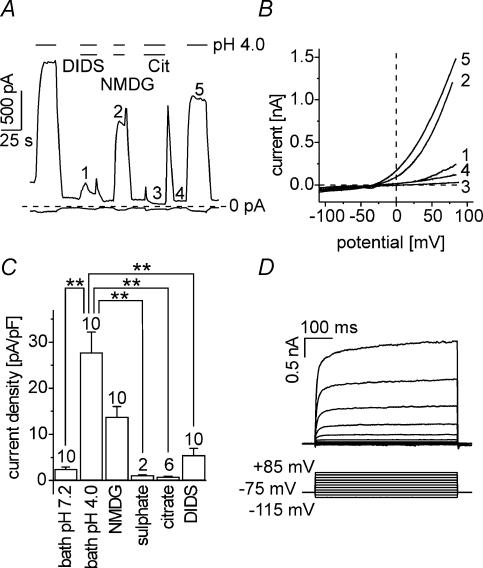
Anion channels are present in every mammalian cell and serve many different functions, including cell volume regulation, ion transport across epithelia, regulation of membrane potential and vesicular acidification. Here we characterize a proton-activated, outwardly rectifying current endogenously expressed in HEK293 cells. Binding of three to four protons activated the anion permeable channels at external pH below 5.5 (50% activation at pH 5.1). The proton-activated current is strongly outwardly rectifying, due to an outwardly rectifying single channel conductance and an additional voltage dependent facilitation at depolarized membrane potentials. The anion channel blocker 4,4'-diisothiocyanostilbene-2,2'-disulphonic acid (DIDS) rapidly and potently inhibited the channel (IC50: 2.9 microm). Flufenamic acid blocked this channel only slowly, while mibefradil and amiloride at high concentrations had no effect. As determined from reversal potential measurements under bi-ionic conditions, the relative permeability sequence of this channel was SCN-> I-> NO3-> Br-> Cl-. None of the previously characterized anion channel matches the properties of the proton-activated, outwardly rectifying channel. Specifically, the proton-activated and the volume-regulated anion channels are two distinct and separable populations of ion channels, each having its own set of biophysical and pharmacological properties. We also demonstrate endogenous proton-activated currents in primary cultured hippocampal astrocytes. The proton-activated current in astrocytes is also carried by anions, strongly outwardly rectifying, voltage dependent and inhibited by DIDS. Proton-activated, outwardly rectifying anion channels therefore may be a broadly expressed part of the anionic channel repertoire of mammalian cells.


Figures

Figure 1
Figure 1. Lowering the pH of the extracellular solution to 4.0 induces an outwardly rectifying current in HEK293 cells
A, current recording of a cell at membrane potentials of +80 mV and –80 mV obtained from voltage ramps during application of acidic extracellular solution (eII, as detailed in Table 2). The activation and deactivation of the current rapidly and repeatedly follows the change of the extracellular solution. Arrowheads point to ASIC-like inward currents. B, corresponding current–voltage relationships at times indicated in A obtained with voltage ramps. C, pH dependence of the outward current at a membrane potential of +80 mV. The current size obtained at various pH values was normalized to the current size obtained with a solution of pH 4.0 in the same cell. The number of cells analysed for each pH value is indicated in the figures. The continuous line was obtained by fitting a Hill equation to the data at pH values ≥ 4.5. The fit yielded the following parameters: Maximum: 1.28, EC50: pH 5.1, Hill coefficient: 3.6.
Figure 2
Figure 2. The outward currents activated at low extracellular pH are carried by anions
A and B, current traces at a membrane potential of +80 mV obtained from repeated voltage ramps. In A, the intracellular solution contained 158 mm Cs+ and 7 mm free Mg2+ (iII, Table 1), while in B, all intracellular cations were replaced with NMDG+ (iIII). The outward current was repeatedly activated by superfusing the recorded cell with acidic (pH 4.0) solutions, in which the main anion was varied. Extracellular solutions eI and eII (at pH 4.0) and eV were used (Table 2). C and D, current–voltage relationships obtained from voltage ramps at the time points indicated in A and B. E, statistical analysis of experiments similar to those shown in A and C. F, statistical analysis of similar experiments in which the extracellular anions were replaced with glutamate and aspartate instead of citrate (solutions eVI and eVII, at pH 4.8, n = 6). G, statistical analysis of similar experiments in which 145 mm aspartate was added to the normal extracellular solution to test for blocking effects of aspartate (solution eVIII, n = 7). H, statistical analysis of experiments similar to that shown in B and D. The only intracellular cation was NMDG+ (solution iIII, n = 5). Note that it is not possible to compare the absolute amplitude of outward current densities between panels E–H, since the use of different batches of cells resulted in differences of current amplitudes even under control conditions (left hand columns in panels E–H). The differences between the current densities with extracellular Cl present compared to those without (panels E, F and H) are statistically significant (P < 0.05).
Figure 3
Figure 3. The inward currents activated at low external pH depend on the intracellular chloride concentration, but not extracellular cations
A and B, current recording at a membrane potential of –80 mV measured before, during and after exposure of the recorded cell to acidic bath solution (solution eII at pH 4.0). Arrowheads denote the transient activation of an ASIC-like current. In A, the pipette (intracellular) solution contained only 20 mm Cl (solution iI), while in B it contained 151 mm Cl (solution iII). The trace shown in A is from a single cell, while the trace in B is the average of identical recordings from 11 cells. In B, all extracellular cations were replaced with NMDG+ as indicated (solutions eIII and eIV). C–E, current–voltage relationships obtained from a single cell measured with voltage ramps at times indicated in A and B. F, statistical analysis of the inward current (at −80 mV) obtained in experiments similar to those shown in A and C. The difference between the two conditions is not statistically significant. G and H, statistical analysis of the inward current (at −80 mV) obtained in the experiment shown in B, D and E. The data in G were obtained with Na+ containing extracellular solutions (eI and eII at pH 4.0), while the data in H were obtained with NMDG+ as the only extracellular cation. The difference between neutral and acidic extracellular conditions was statistically significant as indicated.
Figure 4
Figure 4. The proton-activated, outwardly rectifying anion current (PAORAC) is not affected by strong intracellular buffering of protons or calcium
The size of the proton-activated outward current measured at +80 mV was analysed. A, cells were intracellularly perfused with solutions containing either 10 mm (iX) or 100 mm (iIX) HEPES. The 100 mm HEPES did not prevent the activation of the PAORAC (at pH 4.0) and did not alter the current size (n = 7 for each condition). B, neither strong intracellular Ca2+ buffering (10 mm BAPTA, ‘0’ Ca condition; solution iVIII), nor raising the intracellular Ca2+ concentration to 100 nm (10 mm BAPTA and 2.65 mm total Ca2+; intracellular solution iVII) inhibited PAORAC (elicited by solution eII at pH 4.5, n = 5–6).
Figure 5
Figure 5. The reversal potential of the outwardly rectifying current induced by low extracellular pH strongly depends on the extracellular NaCl concentration
A, individual current–voltage relationships obtained with voltage ramps at different concentrations of NaCl in acidic extracellular solution (solutions eIX–eXII) and with standard bath solution (solution eI). The intracellular solution (iII) contained 151 mm Cl. B, same recordings as in A plotted at a larger scale. C, statistical analysis (n = 6) of the reversal potentials obtained during experiments identical to those shown in A and B. The squares denote values that were obtained without leak subtraction (arrowheads in B), while circles denote values obtained after leak subtraction (arrows in B). The dashed line shows the theoretical Nernst potential for chloride.
Figure 6
Figure 6. Voltage dependence and tail currents of the current activated at low extracellular pH
A, representative current recording of a cell from a holding potential of −55 mV to various membrane potentials as indicated in the lower panel. At depolarizing potentials, the current displays a time-dependent facilitation. B, representative current recording used to determine the instantaneous current voltage relationship with the voltage protocol shown in the lower panel. C, enlarged representation of some of the traces shown in A starting 2 ms after the voltage jump back from the activating voltage (indicated) to the holding potential (−55 mV). The resulting tail currents are small and decay rapidly. D, enlarged representation of some of the traces shown in A starting 2 ms after the voltage jump back from the activating voltage (+95 mV) to the potentials indicated. Traces shown in A–D were leak subtracted by running the same voltage protocol two to four times under acidic (pH 4.8) and normal (pH 7.2) conditions. After averaging, the current traces obtained under normal conditions were subtracted from those obtained under acidic conditions. E, statistical analysis (n = 5) of recordings similar to the traces shown in A and C. The current–voltage relationships were obtained at the time points indicated in A and C, i.e. 2 ms after the voltage jumps in order to ensure that the capacitative transients had subsided. F, instantaneous current–voltage relationships obtained at the time point indicated in B and D. The instantaneous current–voltage relationship shows strong outward rectification. Solutions used: intracellular iII, extracellular eII (at pH 4.8).
Figure 7
Figure 7. Deactivation kinetics of the current induced by low external pH
A, superimposed current traces (upper panel) of a typical recording performed to determine the time course of deactivation. The double-pulse voltage protocol used for these experiments is indicated in the lower panel. B, statistical analysis (n = 5) of recordings similar to that shown in A, showing that the deactivation after hyperpolarizing for 2 ms to −55 mV was only 20%, but was essentially complete after a 400 ms hyperpolarization. Current values were determined 2 ms before the end of the first voltage jump to +95 mV and 2 ms after the beginning of the second voltage jump (also to +95 mV). The current obtained 2 ms after the beginning of the first voltage jump was subtracted from both values, and the quotient between the two was calculated. The percentage of deactivation was obtained as 100 × (1 − quotient). The same solutions as in Fig. 6 were used.
Figure 8
Figure 8. Pharmacological interference with the outward current induced by low extracellular pH
A, typical current traces obtained during the application of acidic conditions (solution eII at pH 4.0) with or without an added pharmacological substance. Pharmacological substances used were DIDS (100 μm), flufenamic acid (FFA, 100 μm), mibefradil (Mib, 100 μm) and amiloride (Amil, 500 μm). Pharmacological substances were added to the acidic bath solution (eII at pH 4.0). B, current–voltage relationships during application of the indicated concentration of DIDS (in μm). Intracellular solution contained 130 mm aspartate and 20 mm Cl (solution iI). C, percentage of inhibition of the outward current (at +80 mV) activated at pH 4.0 achieved by the application of various concentrations of DIDS (n = 4–11). The continuous line was obtained by fitting a Hill equation to the data (maximal inhibition: 95%, IC50: 2.9 μm, Hill coefficient: 1.0). D, statistical analysis of experiments similar to the recordings shown in A. The size of the current 2–3 s after applying the pharmacological substance was analysed relative to the current size in the absence of the inhibitor (the number of cells analysed is indicated). E, FFA slowly blocks the current activated by low external pH. The reduction of the outward current after a 30 s application was assessed during application of the bath solution at pH 4.0 without or with 100 μm FFA. The difference is statistically significant (P < 0.001, n = 7).
Figure 9
Figure 9. Excised patch recordings of proton-activated channels
A, exemplary recording (10 times 5 s) of an excised patch at a holding potential of +86 mV showing the activity of at least two channels. Solution inside the recording pipette (extracellular solution eII) was at pH 5.0 and the solution in the bath was the intracellular solution iII. Traces were digitally smoothed by 500 Hz lowpass filtering for presentation purposes. The dotted lines labelled c, o1 and o2 indicate the closed, one open and two open channels. B, the I–V relationship of the acid-activated channels was determined by ensemble averaging. An excised patch was subjected to repeated voltage ramps (at 1 Hz) as shown in the lower panel. The upper panel shows the 10 superimposed current traces. The middle panel shows the average of 60 traces and the average of traces that did not show any discernible channel activity. The difference between these traces is the ensemble average of the channel activity. C, the ensemble averaged I–V relationship (average of three patches) compared to an I–V relationship measured by whole cell patch clamp recording under similar conditions. Traces were normalized to the current size at +80 mV. D, replacement of the cytosolic cations with NMDG+ does not abolish the single channel events. Shown are six stretches (each 300 ms long) of channel activity recorded from an exemplary, excised inside-out patch (holding potential +86 mV). The recordings in the left and right columns were obtained during superfusion of the cytosolic face of the membrane with standard, CsCl and MgCl2 containing intracellular solution (iII, Table 1). The middle column, however, was recorded with a cytosolic solution in which all cations were replaced with NMDG+. Note that during application of the NMDG+ containing solution, the holding potential is predicted to be reduced by 10 mV (see text for details). The dotted lines labelled c and o indicate closed and opened state of a channel.
Figure 10
Figure 10. The voltage dependence of proton-activated single channel currents is outwardly rectifying
A, recording of an excised patch at different holding potentials (as indicated in mV on the left of the traces). The same solutions as in Fig. 9 were used. Open and closed states are indicated by dotted lines. Traces were digitally low pass filtered at 500 Hz for presentation purposes. The dotted lines labelled c and o indicate closed and opened state of the channel. B, statistical analysis of recordings similar to those shown in A. Number of patches analysed for each data point: 13–29 for depolarized and 7–10 for hyperpolarized holding potentials.
Figure 11
Figure 11. Ionic selectivity of the outwardly rectifying current induced by low pH
A–D, current–voltage relationships obtained with voltage ramps during superfusion of the recorded cells with standard bath solution (pH 7.2; solution eI), acidic bath solution with chloride as main anion (solution eXVII at pH 4.0 in A or pH 4.8 otherwise) or acidic solution containing the sodium salt of the indicated anion (solutions eXIII – eXVI). E, statistical analysis of the reversal potential obtained without background subtraction from recordings similar to those shown in A–D. The reversal potentials obtained with the different anions are all significantly different from each other (P < 0.05).
Figure 12
Figure 12. Volume-regulated anion currents (VRAC), but not proton-activated outwardly rectifying anion currents (PAORAC) are inhibited by 10 mm intracellular Mg2+
Cells were intracellularly perfused with solutions that contained either 0 mm (iV) or 10 mm free Mg2+ concentration (iVI) supplemented with 4 mm Na2ATP and a free Ca2+ concentration of 100 nm.A, the activation of PAORAC (at pH 4.5) and the size of the resulting outward currents (+80 mV) were independent of the intracellular Mg2+ concentration. B, on the contrary, in the same cells activation of the volume-regulated anion current (VRAC) by hypo-osmotic solutions (eXXIV, ca 200 mosmol kg−1) was entirely inhibited by 10 mm free internal Mg2+ (n = 11–12). The difference between the conditions (Mg2+-free or 10 mm Mg2+-containing intracellular solution) is statistically significant, P < 0.01).
Figure 13
Figure 13. Time course of proton-induced effects before and after hypotonically activated volume-regulated anion currents (VRAC)
A, recordings of proton-activated currents at −80 and +80 mV of a cell before (left-hand side) and during (right-hand side) activation of VRAC. Note the transient decrease of outward current (arrow no. 3). B, current–voltage relationships recorded at times indicated by numbered arrows in A. C, statistical analysis (n = 5) of recordings similar to those shown in A. Current amplitudes were measured at +80 mV at times indicated in A. The last column is the subtraction of the current measured at time points 4 and 3. This difference is not statistically different from the current size of PAORAC before the activation of VRAC (column 1). Solutions used: intracellular iV, extracellular eXXIII (pH 7.2 and isotonic, but reduced Cl content, to match the hypotonic solutions), eXXVI (pH 4.5 and isotonic, but reduced Cl content), eXXIV (pH 7.2, hyptonic) and eXXV (pH 4.5, hypotonic).
Figure 14
Figure 14. Volume-regulated (VRAC) and proton-activated (PAORAC) currents can be separated by depolarization induced inhibition of VRAC
Whole cell recording (holding potential 0 mV) of a cell that was subjected to the voltage protocol shown in A, upper panel, before (A and B) and during (D and E) hypo-osmotically induced activation of VRAC. Before and during the activation of VRAC, the cell was assayed under neutral (pH 7.2, A and D) and acidic (pH 4.5, B and E) extracellular conditions. A, the depolarizing pulses provoke only small leak currents in conditions that are isotonic and neutral. B, acidification induces voltage-dependently facilitated outward currents (see also Fig. 6). D, in strong contrast, under neutral but hypotonic conditions, VRAC currents show strong inhibition caused by the depolarizing pulses; note that the inhibition is almost complete by the time of the sixth voltage pulse. E, combining hypotonic and acidic extracellular conditions (pH 4.5), an inhibitory response was observed for the first voltage pulse, but a facilitatory response was seen at the sixth voltage pulse. The amount of inhibition or facilitation was quantified for the first (I) and sixth (VI) voltage pulse (ΔII and ΔIVI) as indicated by the dashed lines. C and F provide a statistical analysis of 5 recordings similar to those shown in the other panels. Cells were analysed that exhibited VRAC current sizes ca 1–3 times larger than PAORAC currents (recorded just before the activation of VRAC). C, before the activation of VRAC, an inhibitory current response was never observed in response to the voltage pulses. F, after induction of VRAC, but without acidification, a facilitatory current response was never observed. Acidification then allowed observation of inhibitory (voltage pulse I) and facilitatory (voltage pulse VI) current responses under the same ionic conditions. The reversal from inhibitory (voltage step I) to facilitatory (voltage step VI) current responses was statistically significant (P < 0.01). Solutions used: intracellular iIV, extracellular eI, eXXV (pH 4.5), eXXIV (hypotonic at pH 7.2).
Figure 15
Figure 15. Primary cultured hippocampal astrocytes possess a current that shares all key characteristics with the current activated at low external pH in HEK293 cells
A, current recording from a cultured hippocampal astrocyte obtained from repeatedly applied voltage ramps (current levels at −80 mV and +80 mV are displayed, holding potential between ramps was −75 mV). Cells were kept in astrocyte bath solution (pH 7.3, solution eXVIII) and acidic solution (pH 4.0, eXIX) was applied as indicated. The acidic solution was either of similar composition to the bath solution, or 100 μm DIDS was added, or all cations were replaced with NMDG+ (eXXI), or the concentration of chloride was reduced (citrate or sulphate as substitute, eXX or eXXII). The composition of the solutions used in these experiments is detailed in Table 3. B, current–voltage relationships obtained with voltage ramps at times indicated in A. C, statistical analysis of experiments similar to those shown in A and B; current densities were obtained from voltage ramps at a membrane potential of +80 mV. Asterisks indicate current densities statistically different (P < 0.01) from current densities obtained while applying the acidic bath solution. D, the current activated at low external pH in astrocytes is voltage dependent when depolarized to positive membrane potentials. The voltage protocol is indicated in the lower panel.

Similar articles

Cited by

References

    1. Accardi A, Miller C. Secondary active transport mediated by a prokaryotic homologue of ClC Cl− channels. Nature. 2004;427:803–807. - PubMed
    1. Ackerman MJ, Wickman KD, Clapham DE. Hypotonicity activates a native chloride current in Xenopus oocytes. J General Physiol. 1994;103:153–179. - PMC - PubMed
    1. Ando-Akatsuka Y, Abdullaev IF, Lee EL, Okada Y, Sabirov RZ. Down-regulation of volume-sensitive Cl− channels by CFTR is mediated by the second nucleotide-binding domain. Pflügers Arch. 2002;445:177–186. - PubMed
    1. Auzanneau C, Thoreau V, Kitzis A, Becq F. A novel voltage dependent chloride current activated by extracellular acidic pH in cultured rat Sertoli cells. J Biol Chem. 2003;278:19230–19236. - PubMed
    1. Blaustein MP, Lederer WJ. Sodium/calcium exchange: its physiological implications. Physiol Rev. 1999;79:763–854. - PubMed

Publication types

MeSH terms