. 2005 Jun 15;25(24):5833-43.
doi: 10.1523/JNEUROSCI.0599-05.2005.

Local protein synthesis mediates a rapid increase in dendritic elongation factor 1A after induction of late long-term potentiation

Affiliations

Local protein synthesis mediates a rapid increase in dendritic elongation factor 1A after induction of late long-term potentiation

Panayiotis Tsokas et al. J Neurosci. .

Abstract

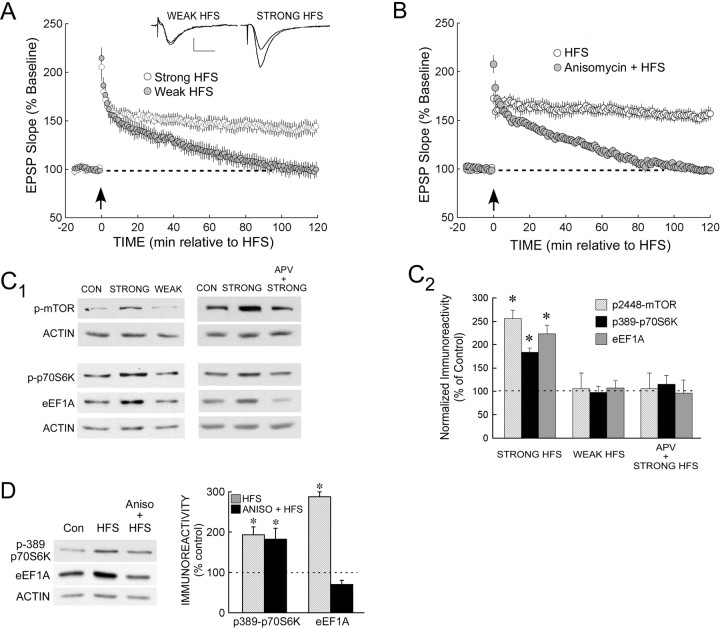
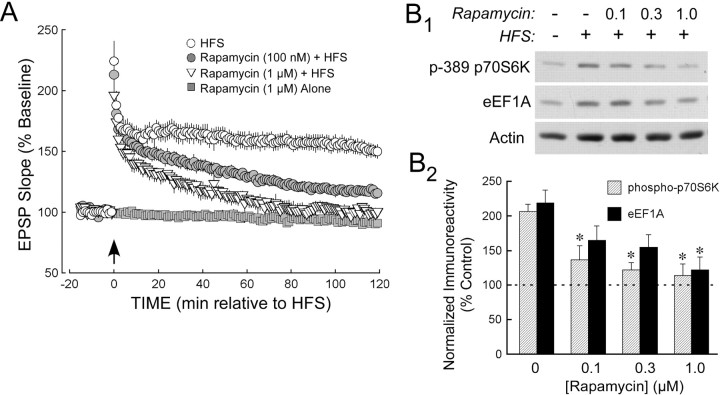
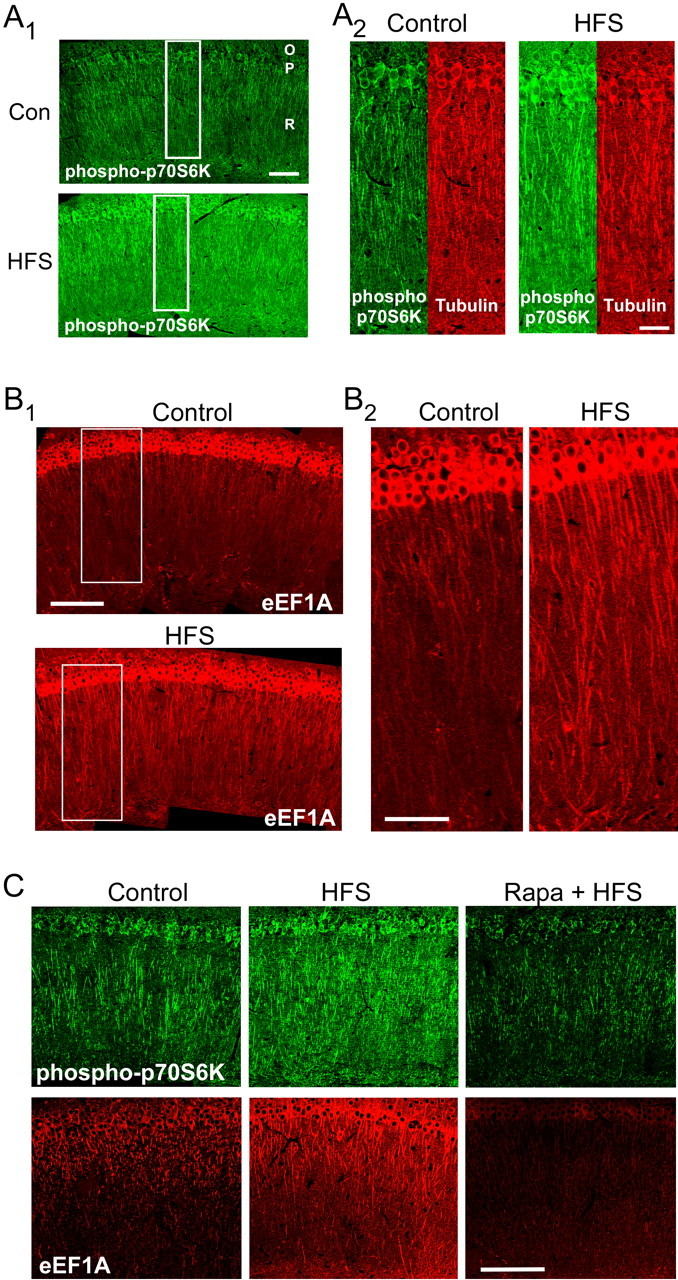
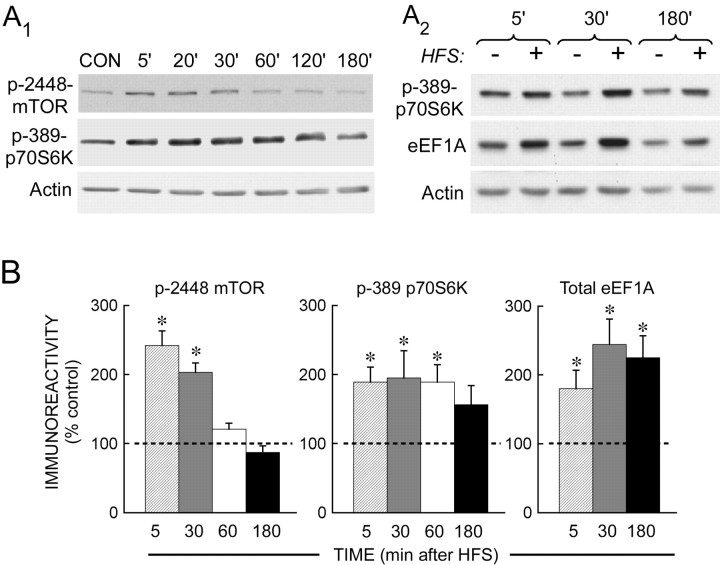
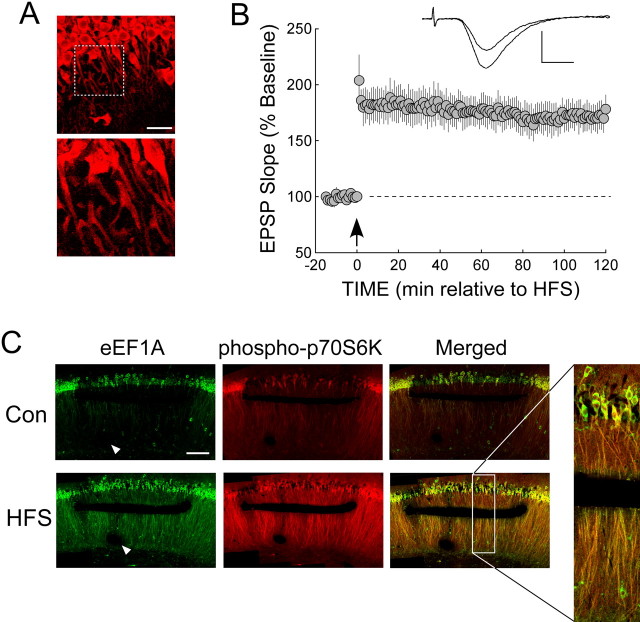
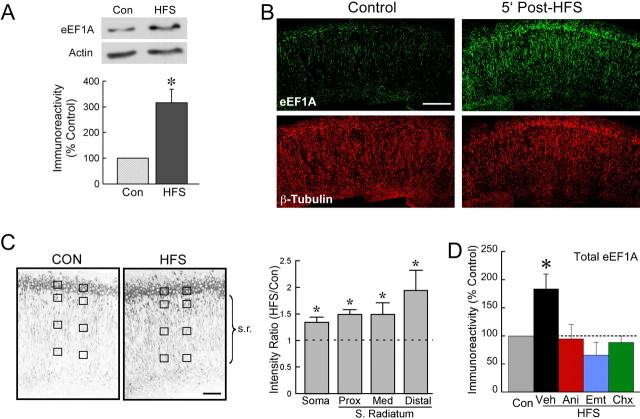
The maintenance of long-term potentiation (LTP) requires a brief period of accelerated protein synthesis soon after synaptic stimulation, suggesting that an early phase of enhanced translation contributes to stable LTP. The mechanism regulating protein synthesis and the location and identities of mRNAs translated are not well understood. Here, we show in acute brain slices that the induction of protein synthesis-dependent hippocampal LTP increases the expression of elongation factor 1A (eEF1A), the mRNA of which contains a 5' terminal oligopyrimidine tract. This effect is blocked by rapamycin, indicating that the increase in EF1A expression is mediated by the mammalian target of rapamycin (mTOR) pathway. We find that mRNA for eEF1A is present in pyramidal cell dendrites and that the LTP-associated increase in eEF1A expression was intact in dendrites that had been severed from their cell bodies before stimulation. eEF1A levels increased within 5 min after stimulation in a translation-dependent manner, and this effect remained stable for 3 h. These results suggest a mechanism whereby synaptic stimulation, by signaling through the mTOR pathway, produces an increase in dendritic translational capacity that contributes to LTP maintenance.


Figures

Figure 1.
Figure 1.
Synaptic stimulation that induces protein synthesis-dependent LTP activates the mTOR pathway and increases eEF1A expression in area CA1. A, Rat hippocampal slices were stimulated, at the time indicated by the arrow, with either two trains of HFS (strong stimulation, as described in Materials and Methods; open symbols; n = 5) or a single train delivered at a lower intensity (weak stimulation; filled symbols; n = 5). Strong HFS produced LTP that persisted for at least 2 h, whereas weak stimulation resulted in only a decremental potentiation that returned to baseline within 2 h. The dashed line represents the normalized baseline value of 100%. Inset traces show superimposed sample fEPSPs recorded during the baseline period and 2 h after weak HFS (left traces) or strong HFS (right traces). Calibration:0.5 mV, 5 ms. B, In slices treated with 10 μm anisomycin (filled symbols; n = 7), the synaptic potentiation that followed strong HFS (delivered at arrow) was decremental, returning to baseline within 90 min. In contrast, vehicle-treated controls (open symbols; n = 7) showed LTP that was stable for 2 h. C, Strong stimulation, but not weak stimulation, activated the mTOR pathway and increased eEF1A levels in area CA1 in an NMDA receptor-mediated manner. C1, Left, Representative immunoblots from homogenates of CA1 regions from slices that had been frozen 30 min after control stimulation (CON; left lane), strong HFS (center lane), or weak HFS (right lane). Right, Immunoblots from CA1 regions of slices that received either control stimulation (left lane) or strong HFS after preincubation with vehicle (center lane) or 50 μm d-APV (right lane). Membranes were probed for phospho(Ser2448)-mTOR and actin (top) or for phospho(Thr389)-p70S6K, total eEF1A, and actin (bottom). C2, Summary data showing mean immunoreactivity for each protein as determined by densitometry, normalized to control values within the same immunoblot. Strong stimulation increased immunoreactivity for phospho-mTOR [n = 6; p < 0.001 vs controls (n = 7)], phospho-p70S6K [n = 15; p < 0.001 vs controls (n = 15)], and eEF1A [n = 10; p < 0.001 vs controls (n = 10)], but weak stimulation had no effect on these proteins (all p values > 0.10; for phospho-mTOR, n = 3 and control, n = 7; for phospho-p70S6K, n = 10 and control, n = 15; for eEF1A, n = 7 and control, n = 10). Asterisks indicate significant differences from control, which is represented by the dashed line. Preincubation with d-APV blocked the ability of strong HFS to increase the phosphorylation of mTOR [for APV treated, n = 5; p > 0.10 vs controls (n = 7)] and the phosphorylation of p70S6K [for APV treated, n = 6; p > 0.10 vs controls (n = 15)], as well as the expression of eEF1A [for APV treated, n = 4; p > 0.10 vs controls (n = 10)]. Asterisks indicates significant differences from control. D, Anisomycin blocked the ability of strong HFS to increase eEF1A expression. Left, Representative immunoblot of CA1 homogenates taken from slices that had received control stimulation (Con; left lane) or strong HFS after preincubation with either vehicle (center lane) or 10 μm anisomycin (Aniso). Slices had been frozen 30 min after stimulation. Right, Summary data showing that the activation by strong HFS of the mTOR pathway in area CA1 was intact in anisomycin (ANISO)-treated slices, as shown by the phosphorylation of p70S6K at T389 (left columns). However, anisomycin completely blocked the HFS-induced increase in eEF1A immunoreactivity (right columns), indicating translation-dependent expression of eEF1A in response to strong HFS [in vehicle-treated slices, phospho-p70S6K (n = 3), p < 0.05 vs controls (n = 3); eEF1A (n = 3), p < 0.01 vs controls (n = 3); in anisomycin-treated slices, phospho-p70S6K (n = 3), p < 0.05 vs controls (n = 3); eEF1A (n = 3), p > 0.10 vs controls (n = 3; two-tailed t test)]. Asterisks indicate significant differences from control. Error bars represent SE.
Figure 2.
Figure 2.
The mTOR pathway is required for stable LTP and for the HFS-induced expression of eEF1A. A, Rapamycin blocks the maintenance of LTP induced by strong HFS. In slices pretreated with vehicle (0.5% DMSO), strong HFS induced stable LTP (open circles; n = 7). However, treatment of slices with 100 nm or 1 μm rapamycin [filled circles (n = 6) and open triangles (n = 6), respectively] produced a dose-dependent block of translation-dependent LTP after HFS (for fEPSP slope measured over the 5 min period ending 2 h after HFS and normalized to baseline, vehicle vs 100 nm rapamycin, p < 0.01; vehicle vs 1 μm rapamycin, p < 0.01; 100 nm vs 1 μm rapamycin, p < 0.01). Rapamycin had little effect on basal synaptic efficiency, indicating that the mTOR requirement is specific to potentiated synapses. B, Rapamycin blocks the increase in eEF1A expression within area CA1 after strong HFS. B1, Immunoblots of CA1 homogenates from slices that had received control stimulation in the presence of vehicle (lane 1), strong HFS in the presence of vehicle (lane 2), or different concentrations of rapamycin (lanes 3-5; rapamycin concentration indicated in μm). HFS increased phospho(T389)-p70S6K and total eEF1A, and rapamycin blocked these effects in a concentration-dependent manner. B2, Summary of rapamycin concentration-response experiments for the blockade of HFS-induced increases in p70S6K phosphorylation (hatched columns) and eEF1A expression (filled columns). The asterisks indicate differences from HFS delivered in the presence of vehicle, and the dashed line indicates the normalized control value. Note that rapamycin was effective in the same concentration range as that used for the inhibition of LTP maintenance. The HFS-induced increase in phospho-p70S6K immunoreactivity was significantly reduced (all p values < 0.01) by 100 nm (n = 9), 300 nm (n = 9), and 1 μm rapamycin (n = 8), compared with vehicle-treated slices (n = 9); the increase in eEF1A immunoreactivity was significantly inhibited by 1 μm rapamycin (n = 6; p < 0.01) but not by 100 nm (n = 7) or 300 nm (n = 7) (for both, 0.10 > p > 0.05). Error bars represent SE.
Figure 3.
Figure 3.
Strong HFS increases eEF1A expression in dendrites. A, Slices received either control stimulation or strong HFS and were fixed 30 min later, sectioned, and labeled with antibodies for phospho(T389)-S6K. A1, HFS increased immunoreactivity throughout the dendrites of the stratum radiatum (R), in the nuclei and cell bodies of the stratum pyramidale (P), and within the stratum oriens (O). These and all subsequent immunohistochemical images are oriented with area CA3 toward the left. Scale bar, 100 μm. Con, Control. A2, Expanded regions of control and HFS-treated sections corresponding to the rectangles in A1, showing immunoreactivity for phospho(T389)-S6K (green) and tubulin (red). Tubulin immunoreactivity was not increased by HFS. These results are representative of >10 experiments. Scale bar, 50 μm. B, eEF1A immunoreactivity in sections from slices that had received control stimulation (top image) or strong HFS (bottom image) 30 min before fixation. B1, Immunoreactivity for eEF1A was markedly stronger in the dendrites of the stratum radiatum after HFS, with smaller effects in the stratum pyramidale and stratum oriens. Scale bar, 200 μm. B2, Expansion of areas indicated by the rectangles in B1. Within individual dendrites of the stratum radiatum in the HFS-treated slice, eEF1A immunoreactivity was relatively intense and nearly uniform from proximal to distal regions. These results are representative of >10 experiments. Scale bar, 100 μm. C, Rapamycin (Rapa) prevents the increase in dendritic eEF1A expression after strong HFS. Immunohistochemical analysis was performed on sections using antibodies for phospho(T389)-S6K (top) and eEF1A (bottom). Within the dendrites of the stratum radiatum, HFS increased immunoreactivity for phospho-S6K and for total eEF1A compared with slices that had received control stimulation (left and middle panels; vehicle only). The effects were blocked by 300 nm rapamycin (right panels). Results are representative of eight experiments for phospho-S6K and 12 experiments for eEF1A. Scale bar, 200 μm.
Figure 4.
Figure 4.
The HFS-induced increase in eEF1A expression is rapid and sustained in area CA1. A, Representative immunoblots for the time course of mTOR pathway activation and eEF1A expression after strong HFS. A1, An immunoblot of CA1 homogenates from slices that had received either control stimulation for 90 min before slice freezing (CON) or HFS 5-180 min before freezing. Immunoreactivity for phospho(S2448)-mTOR showed a maximal increase at 5-20 min, followed by a decline to control levels within 1 h. Phospho(T389)-p70S6K peaked somewhat later and remained elevated for ∼2 h. A2, Immunoblot of CA1 homogenates from time-matched control slices and HFS-treated slices. HFS caused eEF1A expression to increase as early as 5 min after stimulation, an effect that was maintained for 3 h. The phosphorylation of p70S6K showed a similar time course. B, Summary of time-course experiments for the HFS-induced activation of the mTOR pathway and expression of eEF1A. The phosphorylation of mTOR (left) and p70S6K (middle) and the increase in eEF1A expression (right) were all significantly increased 5 min after HFS. However, mTOR phosphorylation was relatively brief, and the increase in eEF1A relatively stable. For phospho-mTOR, at 5 min, n = 3, p < 0.05; at 30 min, n = 3, p < 0.01; at 60 min, n = 3, p > 0.05; at 180 min, n = 3, p > 0.10, with all values compared with controls (n = 5). For phospho-p70S6K, at 5 min, n = 7, p < 0.01; at 30 min, n = 5, p < 0.05; at 60 min, n = 3, p < 0.05; at 180 min, n = 3, 0.10 > p > 0.05, with all values compared with controls (n = 9). For eEF1A, at 5 min, n = 5; p < 0.05; at 30 min, n = 4, p < 0.05; at 180 min, n = 3, p < 0.05, with all values compared with controls (n = 6). The dashed line represents the normalized control value, and the asterisks indicate significant differences from control. Error bars represent SE.
Figure 5.
Figure 5.
Local mechanisms are sufficient for the HFS-induced increase in dendritic eEF1A. A, FISH with oligonucleotide probes based on the mRNA sequence for rat eEF1A. In sections prepared from perfusion-fixed rat brain, mRNA for eEF1A was detected in area CA1 within the cell bodies of the stratum pyramidale (top image) and in the dendrites of the stratum radiatum (top image and detail in bottom image). Control FISH experiments using fluorescently labeled scrambled probe or labeled eEF1A probe in the presence of excess unlabeled eEF1A probe gave no detectable signal above background when imaged at the same exposure (data not shown) (Chan et al., 2005). These control studies demonstrate that the labeling observed in neuronal processes is specific for eEF1A sequence. Scale bar, 50 μm. B, LTP was recorded in the CA1 stratum radiatum of slices in which a cut separated the apical dendrites from the cell bodies proximal to the recording electrode. Strong HFS delivered 2 h after the cut had been made (see Materials and Methods) produced a stable LTP that was maintained for 2 h (n = 5). The inset traces show superimposed fEPSPs recorded during the baseline period and 2 h after HFS. Calibration: 1 mV, 5 ms. C, The HFS-induced increase in eEF1A expression was intact in dendrites separated from their cell bodies. Immunohistochemical analysis was performed on slices in which cuts had been made in the stratum radiatum before control stimulation (Con; top images) or two-train HFS (bottom images). The slices were fixed 1 h after stimulation. The HFS-induced increases in the phosphorylation of S6K at T389 (middle panels), and, more importantly, the expression of eEF1A (left panels) in the separated dendrites were similar to those obtained in the adjacent intact dendrites. Merged images of phospho-S6K and eEF1A immunofluorescence (right panels and expanded image) show a high degree of colocalization for the active mTOR pathway and the expression of eEF1A within the separated dendrites. These images are representative of three experiments for phospho-S6K and four experiments for eEF1A. The arrowhead indicates the placement of the recording electrode. Scale bar, 150 μm.
Figure 6.
Figure 6.
Dendritic eEF1A increases rapidly and in a protein synthesis-dependent manner in response to stimulation that induces late LTP. A, Homogenates of the stratum radiatum that had been microdissected from slices frozen 5 min after strong HFS were immunoblotted for eEF1A and actin. A representative blot shows that eEF1A immunoreactivity was increased, and the summary data indicate that this effect was at least as robust as that seen in homogenates of complete CA1 regions that include cell bodies (compare with Figs. 2 and 6D). For stimulated slices (n = 3) versus controls (n = 3), *p < 0.05. B, Throughout the apical dendritic arbor, strong HFS rapidly increases immunoreactivity for eEF1A. Sections from slices fixed 5 min after HFS (right panels) and labeled with antibodies for eEF1A (green) and β-tubulin (red) showed enhanced dendritic eEF1A immunoreactivity, even in the most distal dendrites of the stratum radiatum, when compared with controls (left panels). Tubulin immunoreactivity was not affected by HFS. Scale bar, 200 μm. These results are representative of six experiments. C, The increase in eEF1A expression is most pronounced in distal dendrites soon after HFS. The grayscale images on the left show sample sections from slices that had received either control stimulation or strong HFS, followed by fixation 5 min later. The sections were labeled with antibodies against eEF1A, and the intensity of fluorescence was determined within defined areas evenly distributed along the stratum pyramidale and within the stratum radiatum (s.r.) at ∼50, 200, and 350 μm from the cell bodies (referred to as proximal, medial, and distal; see Materials and Methods). Two sets of sampled areas are indicated by the rectangles in the images; for each tissue section, > 10 sets were sampled within area CA1. Mean immunofluorescent intensity for each region was obtained by averaging the sampled areas within that region. Scale bar, 100 μm. The summary data on the right express the mean intensity for each region in slices that had received strong HFS, normalized to the corresponding region in time-matched control slices. Mean immunofluorescence was increased within the stratum pyramidale and in all regions of the stratum radiatum, indicating that eEF1A expression increased in the most distal dendrites in concert with the increase in more proximal (Prox) regions, including the cell bodies. The dashed line indicates the normalized control value, and asterisks indicate significant differences from control. Compared with controls, HFS increased immunofluorescence in the somatic (n = 3; p < 0.05), proximal dendritic (n = 3; p < 0.01), medial (Med) dendritic (n = 3; p < 0.05), and distal dendritic regions (n = 3; p < 0.01). D, Protein synthesis is required for the HFS-induced increase in eEF1A expression. Strong HFS was delivered to slices that had been pretreated with 10 μm anisomycin (Ani; n = 5), 20 μm emetine (Emt; n = 3), 60 μm cycloheximide (Chx; n = 3), or 0.1% DMSO (Veh; n = 7) and frozen 5 min later. Excised CA1 regions were probed for eEF1A by Western blots, and immunoreactivity was normalized to that of drug- or vehicle-treated control slices. All three translation inhibitors prevented the increase in eEF1A immunoreactivity; the asterisk indicates significant difference (p < 0.05) from control value. Con, Control. Error bars represent SE.

Similar articles

Cited by

References

    1. Aloni R, Peleg D, Meyuhas O (1992) Selective translational control and nonspecific posttranscriptional regulation of ribosomal protein gene expression during development and regeneration of rat liver. Mol Cell Biol 12: 2203-2212. - PMC - PubMed
    1. Baas PW, Deitch JS, Black MM, Banker GA (1988) Polarity orientation of microtubules in hippocampal neurons: uniformity in the axon and non-uniformity in the dendrite. Proc Natl Acad Sci USA 85: 8335-8339. - PMC - PubMed
    1. Biberman Y, Meyuhas O (1997) Substitution of just five nucleotides at and around the transcription start site of rat β-actin promoter is sufficient to render the resulting transcript a subject for translational control. FEBS Lett 405: 333-336. - PubMed
    1. Cammalleri M, Lutjens R, Berton F, King AR, Simpson C, Francesconi W, Sanna PP (2003) Time-restricted role for dendritic activation of the mTOR-p70S6K pathway in the induction of late-phase long-term potentiation in the CA1. Proc Natl Acad Sci USA 100: 14368-14373. - PMC - PubMed
    1. Chan P, Gonzalez-Maeso J, Ruf F, Bishop DF, Hof PR, Sealfon SC (2005) Epsilon sarcoglycan immunoreactiviy and mRNA expression in mouse brain. J Comp Neurol 482: 50-73. - PubMed

Publication types

LinkOut - more resources