

Mapping of transcription start sites in Saccharomyces cerevisiae using 5' SAGE
- PMID: 15905473
- PMCID: PMC1131933
- DOI: 10.1093/nar/gki583
Mapping of transcription start sites in Saccharomyces cerevisiae using 5' SAGE
Abstract
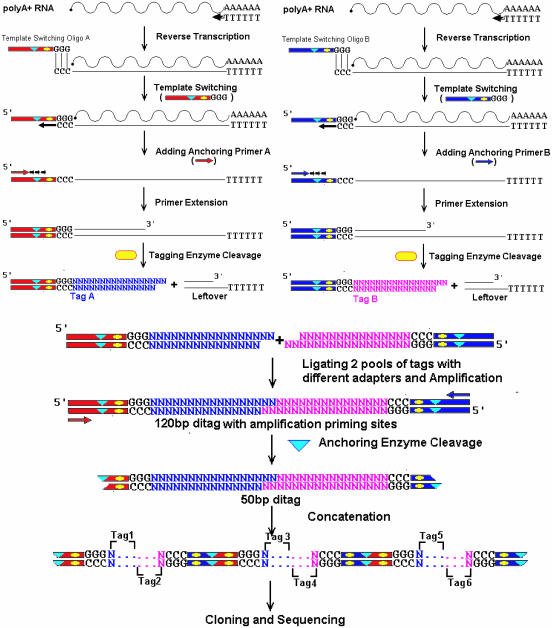
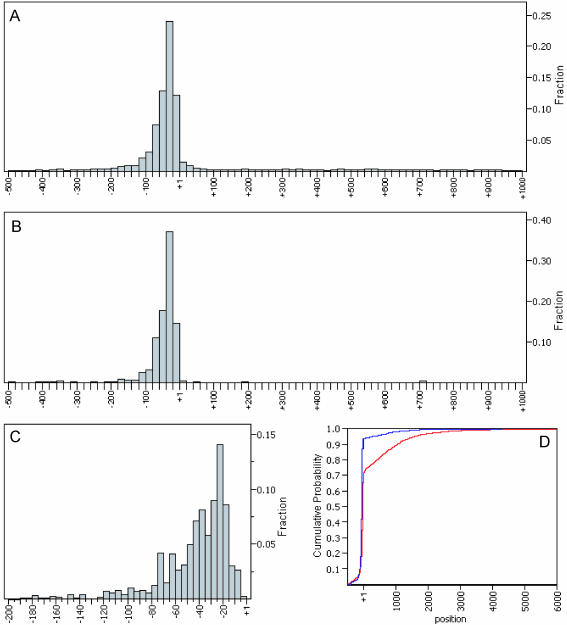
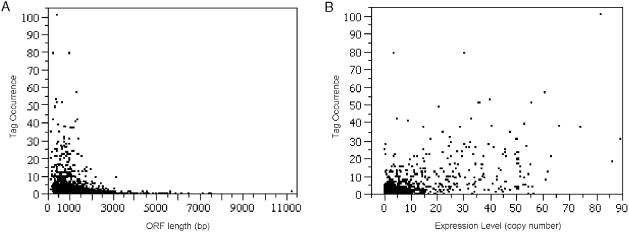
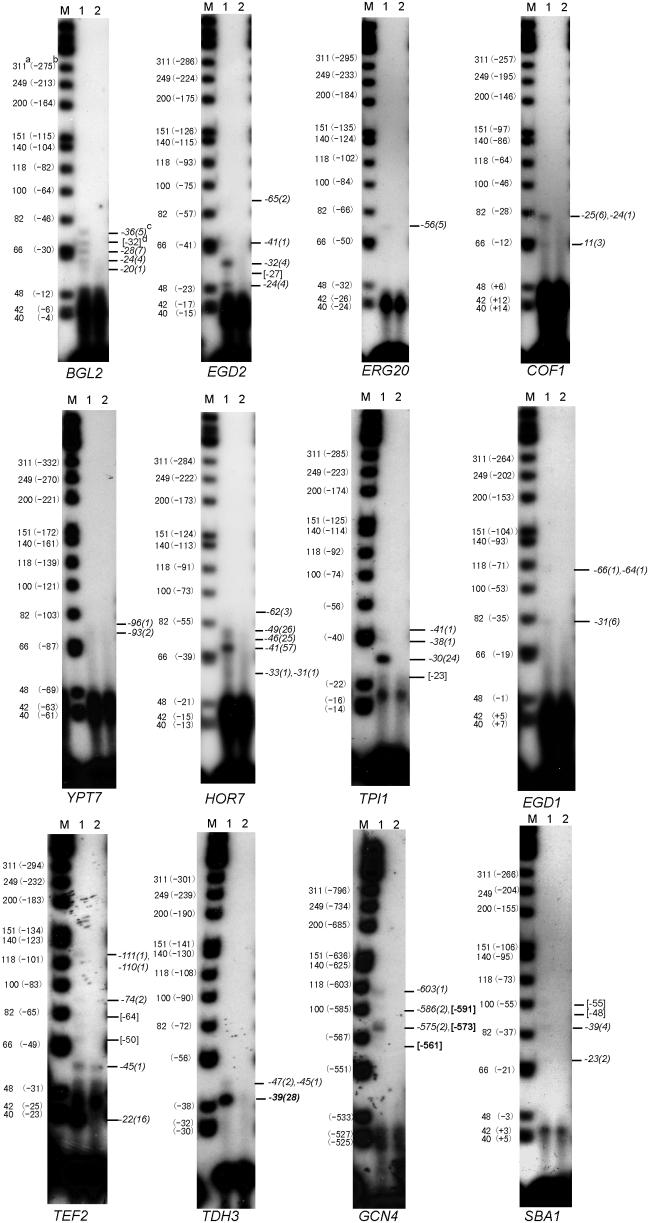
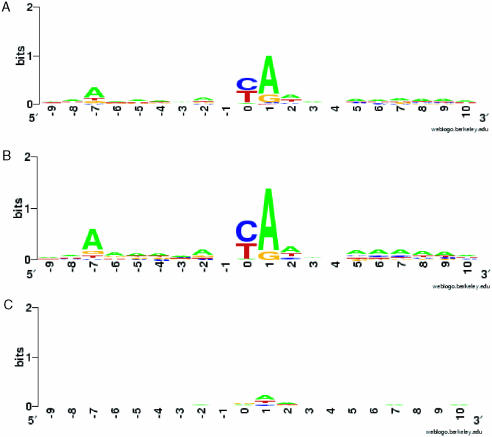
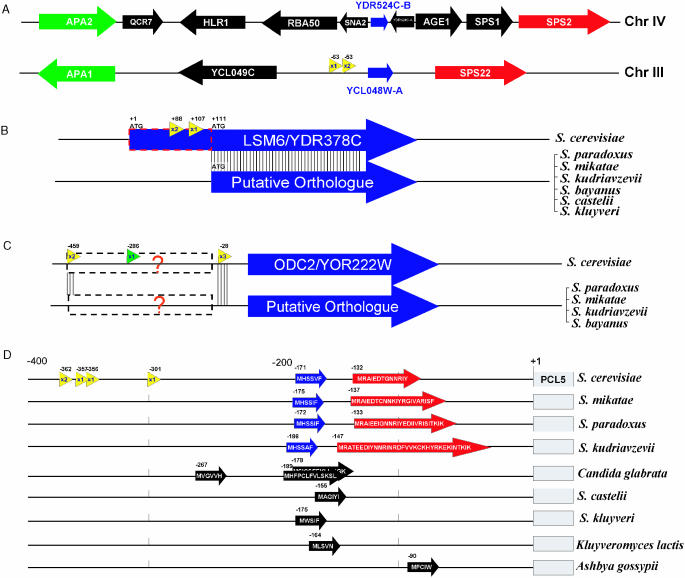
A minimally addressed area in Saccharomyces cerevisiae research is the mapping of transcription start sites (TSS). Mapping of TSS in S.cerevisiae has the potential to contribute to our understanding of gene regulation, transcription, mRNA stability and aspects of RNA biology. Here, we use 5' SAGE to map 5' TSS in S.cerevisiae. Tags identifying the first 15-17 bases of the transcripts are created, ligated to form ditags, amplified, concatemerized and ligated into a vector to create a library. Each clone sequenced from this library identifies 10-20 TSS. We have identified 13,746 unique, unambiguous sequence tags from 2231 S.cerevisiae genes. TSS identified in this study are consistent with published results, with primer extension results described here, and are consistent with expectations based on previous work on transcription initiation. We have aligned the sequence flanking 4637 TSS to identify the consensus sequence A(A(rich))5NPyA(A/T)NN(A(rich))6, which confirms and expands the previous reported PyA(A/T)Pu consensus pattern. The TSS data allowed the identification of a previously unrecognized gene, uncovered errors in previous annotation, and identified potential regulatory RNAs and upstream open reading frames in 5'-untranslated region.
Figures
Similar articles
-
Global identification of transcription start sites in the genome of Apis mellifera using 5'LongSAGE.J Exp Zool B Mol Dev Evol. 2011 Nov 15;316(7):500-14. doi: 10.1002/jez.b.21421. Epub 2011 Jun 21. J Exp Zool B Mol Dev Evol. 2011. PMID: 21695780
-
TSS-EMOTE, a refined protocol for a more complete and less biased global mapping of transcription start sites in bacterial pathogens.BMC Genomics. 2016 Nov 2;17(1):849. doi: 10.1186/s12864-016-3211-3. BMC Genomics. 2016. PMID: 27806702 Free PMC article.
-
Accurate and unambiguous tag-to-gene mapping in serial analysis of gene expression.BMC Bioinformatics. 2006 Nov 4;7:487. doi: 10.1186/1471-2105-7-487. BMC Bioinformatics. 2006. PMID: 17083742 Free PMC article.
-
[Decade of genomics--methods for genome investigation in yeast Saccharomyces cerevisiae].Postepy Biochem. 2006;52(4):435-47. Postepy Biochem. 2006. PMID: 17536513 Review. Polish.
-
Evolutionary roles of upstream open reading frames in mediating gene regulation in fungi.Annu Rev Microbiol. 2009;63:385-409. doi: 10.1146/annurev.micro.62.081307.162835. Annu Rev Microbiol. 2009. PMID: 19514854 Review.
Cited by
-
Analysis of promoter function in Aspergillus fumigatus.Eukaryot Cell. 2012 Sep;11(9):1167-77. doi: 10.1128/EC.00174-12. Epub 2012 Jul 27. Eukaryot Cell. 2012. PMID: 22843562 Free PMC article.
-
Repression of sulfate assimilation is an adaptive response of yeast to the oxidative stress of zinc deficiency.J Biol Chem. 2009 Oct 2;284(40):27544-56. doi: 10.1074/jbc.M109.042036. Epub 2009 Aug 5. J Biol Chem. 2009. PMID: 19656949 Free PMC article.
-
Evidence that RNA polymerase II and not TFIIB is responsible for the difference in transcription initiation patterns between Saccharomyces cerevisiae and Schizosaccharomyces pombe.Nucleic Acids Res. 2012 Aug;40(14):6495-507. doi: 10.1093/nar/gks323. Epub 2012 Apr 17. Nucleic Acids Res. 2012. PMID: 22510268 Free PMC article.
-
Yeast Pol II start-site selection: the long and the short of it.EMBO Rep. 2008 Nov;9(11):1084-6. doi: 10.1038/embor.2008.192. Epub 2008 Oct 10. EMBO Rep. 2008. PMID: 18846104 Free PMC article. No abstract available.
-
Upstream sequence elements direct post-transcriptional regulation of gene expression under stress conditions in yeast.BMC Genomics. 2009 Jan 7;10:7. doi: 10.1186/1471-2164-10-7. BMC Genomics. 2009. PMID: 19128476 Free PMC article.
References
-
- Dietrich F.S., Voegeli S., Brachat S., Lerch A., Gates K., Steiner S., Mohr C., Pohlmann R., Luedi P., Choi S., et al. The Ashbya gossypii genome as a tool for mapping the ancient Saccharomyces cerevisiae genome. Science. 2004;304:304–307. - PubMed
-
- Kellis M., Birren B.W., Lander E.S. Proof and evolutionary analysis of ancient genome duplication in the yeast Saccharomyces cerevisiae. Nature. 2004;428:617–624. - PubMed
-
- Cliften P., Sudarsanam P., Desikan A., Fulton L., Fulton B., Majors J., Waterston R., Cohen B.A., Johnston M. Finding functional features in Saccharomyces genomes by phylogenetic footprinting. Science. 2003;301:71–76. - PubMed
-
- Zhang Z., Dietrich F.S. Verification of a new gene on Saccharomyces cerevisiae chromosome III. Yeast. 2003;20:731–738. - PubMed
Publication types
MeSH terms
LinkOut - more resources
Full Text Sources
Other Literature Sources
Molecular Biology Databases
