. 2005 Jul;16(7):3289-300.
doi: 10.1091/mbc.e04-09-0816. Epub 2005 May 11.

ELKS, a protein structurally related to the active zone-associated protein CAST, is expressed in pancreatic beta cells and functions in insulin exocytosis: interaction of ELKS with exocytotic machinery analyzed by total internal reflection fluorescence microscopy

Affiliations

ELKS, a protein structurally related to the active zone-associated protein CAST, is expressed in pancreatic beta cells and functions in insulin exocytosis: interaction of ELKS with exocytotic machinery analyzed by total internal reflection fluorescence microscopy

Mica Ohara-Imaizumi et al. Mol Biol Cell. 2005 Jul.

Abstract

The cytomatrix at the active zone (CAZ) has been implicated in defining the site of Ca2+-dependent exocytosis of neurotransmitters. Here, we demonstrate the expression and function of ELKS, a protein structurally related to the CAZ protein CAST, in insulin exocytosis. The results of confocal and immunoelectron microscopic analysis showed that ELKS is present in pancreatic beta cells and is localized close to insulin granules docked on the plasma membrane-facing blood vessels. Total internal reflection fluorescence microscopy imaging in insulin-producing clonal cells revealed that the ELKS clusters are less dense and unevenly distributed than syntaxin 1 clusters, which are enriched in the plasma membrane. Most of the ELKS clusters were on the docking sites of insulin granules that were colocalized with syntaxin 1 clusters. Total internal reflection fluorescence images of single-granule motion showed that the fusion events of insulin granules mostly occurred on the ELKS cluster, where repeated fusion was sometimes observed. When the Bassoon-binding region of ELKS was introduced into the cells, the docking and fusion of insulin granules were markedly reduced. Moreover, attenuation of ELKS expression by small interfering RNA reduced the glucose-evoked insulin release. These data suggest that the CAZ-related protein ELKS functions in insulin exocytosis from pancreatic beta cells.


Figures
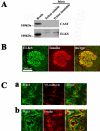
Figure 1.
Figure 1.
ELKS is present in pancreatic islet β cells. (A) Immunoblot analysis of the pancreatic islet lysate by using anti-CAST and anti-ELKS antibodies. Rat brain homogenate (used as positive control) and rat pancreatic islet lysate (1% Triton X-100 –soluble and –insoluble fractions) (20 μg of each protein) were analyzed by immunoblotting by using anti-CAST or anti-ELKS pAbs. Note that rat islets expressed ELKS but not CAST, whereas rat brain expressed both CAST and ELKS. (B) Colocalization of ELKS and insulin in rat pancreatic islets as determined by immunofluorescence labeling and confocal laser microscopy. Islets were immunostained for ELKS and insulin and were viewed in the green (ELKS) or the red (insulin) channel. There was significant overlap (merged [yellow]) of ELKS and insulin immunofluorescence. Magnification, 10×; bars, 200 μm. (C) Localization of ELKS, insulin, and VE-cadherin in islets by immunofluorescence labeling and confocal laser microscopy with higher magnification (100×). Islets were double stained using anti-ELKS pAb and anti-VE-cadherin mAb (a) or anti-insulin mAb (b). Bars, 20 μm.
Figure 2.
Figure 2.
Ultrastructural localization of ELKS in β cells. Ultrathin sections of the rat pancreas were reacted with the anti-ELKS pAb, and then with 12-nm colloidal gold-conjugated donkey anti-rabbit IgG antibody. Next, they were incubated with anti-insulin mAb and then with 18-nm colloidal gold-conjugated donkey anti-mouse IgG antibody. Note that the immunoreactivity of ELKS (small gold particles) was frequently detected close to insulin-containing granules (large gold particles) docked on the plasma membrane facing blood capillary (arrows). B, β cell; C, blood capillary; E, endothelial cell; ECS, extracellular space. Bar, 0.2 μm.
Figure 3.
Figure 3.
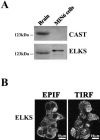
ELKS is present in MIN6 β cells. (A) Immunoblot analysis of CAST and ELKS proteins. The homogenates of rat brain (used as a positive control) and MIN6 β cells (20 μg of each protein) were analyzed by immunoblotting by using anti-CAST or anti-ELKS pAbs. Note that MIN6 cells expressed ELKS but not CAST. (B) Immunofluorescence staining of MIN6 cells with anti-ELKS pAb observed by EPIF microscopy and TIRFM. Cells were fixed and immunostained using anti-ELKS pAb and Alexa Fluor 488-conjugated anti-rabbit secondary antibody. EPIF images were observed by inverted EPIF microscopy, and TIRF images were observed by simply shifting the mirror in the same cells. Bars, 10 μm.
Figure 4.
Figure 4.
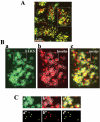
Colocalization of ELKS clusters and insulin granules in the plasma membrane of MIN6 cells analyzed by TIRFM. (A) Cells were fixed and double immunostained using anti-ELKS pAb, anti-insulin mAb, and secondary antibodies (Alexa Fluor-488–conjugated anti-rabbit and Alexa Fluor-546–conjugated anti-mouse antibodies). The colocalization of ELKS clusters (green) and insulin granules (red) is demonstrated by the overlap (yellow) of green and red channel images. (B) Most ELKS clusters (a, green) corresponded to sites of docked insulin granules (b, red). Box in the abovementioned image indicates the region that is magnified below. Each circle (1 μm in diameter) in the green channel corresponds to the circle in the red channel. Solid circles represent the colocalization of ELKS clusters and insulin granules (positive). Dotted circles indicate observed ELKS clusters but not insulin granules (negative). Dashed circles indicate ELKS clusters with only a partially corresponding overlap (neutral). (C) Boxes in the above-mentioned images indicate regions that are magnified below. Inner circles (400 nm in diameter) were drawn around fluorescent spots in each image (a′, b′, and c′). Sizes of circles in images (a′) and (b′) were reduced to 64% (257 nm in diameter) and 68% (270 nm in diameter), respectively, to correct to the real diameters (a″ and b″), and these were transferred to identical pixel localizations (c″). Circles of ELKS clusters (green) and insulin granules (red) overlapped (rated as positive).
Figure 5.
Figure 5.
Insulin granules are preferentially docked to ELKS clusters colocalized with syntaxin 1 clusters. Cells were fixed and triple immunostained using rabbit anti-ELKS pAb, mouse anti-syntaxin 1 mAb, guinea pig anti-insulin pAb, and secondary antibodies (Alexa Fluor-546–conjugated anti-rabbit, Alexa Fluor-633–conjugated anti-mouse, and fluorescein-conjugated anti-guinea pig antibodies) and then were observed using TIRFM with an arc-lamp source. Colocalization was rated as described in Figure 4. Solid circles (1 μm in diameter) represent the insulin granules colocalized with ELKS and syntaxin 1 clusters. Dotted circles indicate observed insulin granules not colocalized with syntaxin 1 and ELKS clusters. Dashed circles indicate insulin granules with ELKS clusters or syntaxin 1 clusters.
Figure 6.
Figure 6.
Colocalization of ELKS and syntaxin 1 clusters in the plasma membrane. (A) Cells were fixed and double immunostained using anti-ELKS pAb, anti-syntaxin 1 mAb, and secondary antibodies (Alexa Fluor-488–conjugated anti-rabbit and Alexa Fluor-546–conjugated anti-mouse antibodies). The colocalization of ELKS clusters (green) and syntaxin 1 clusters (red) is demonstrated by the overlap (yellow) of red and green channel images. (B) A majority of ELKS clusters (green) colocalized with syntaxin 1 clusters (red). Box in the above-mentioned image indicates the region that is magnified below. Each circle (1 μm in diameter) in the green channel corresponds to the circle in the red channel. Colocalization was rated as described in Figure 4. The real diameters of ELKS and syntaxin 1 clusters were calculated as 257 ± 35 and 280 ± 37 nm on the basis of the apparent size of the ELKS and syntaxin 1 clusters (417 ± 21 and 431 ± 24 nm, respectively, n = 6 cells). Solid circles represent the colocalization of ELKS and syntaxin 1 clusters (positive). Dotted circles indicate observed ELKS clusters but not syntaxin 1 clusters (negative). Dashed circles indicate ELKS clusters with only partially corresponding overlap (neutral).
Figure 7.
Figure 7.
ELKS clusters are sites for docking and fusion of insulin granules in living cells. (A) TIRF image of ELKS in the plasma membrane labeled with TAT-conjugated Cy3-labeled anti-ELKS mAb and stained with anti-ELKS pAb. After MIN6 cells were treated with TAT-conjugated Cy3-labeled anti-ELKS mAb for 30 min, cells were fixed and immunostained with anti-ELKS pAb and then were observed with TIRFM. There was significant colocalization (c) between ELKS clusters labeled with TAT-conjugated, Cy3-labeled antibody (a) and those stained with pAb (b). (B) TIRF image of GFP-tagged insulin granules and Cy3-labeled ELKS clusters in living MIN6 cells and dual image analysis of GFP-tagged insulin granule motion at ELKS clusters during 50 mM KCl stimulation. Three days after MIN6 cells were transfected with the expression vector insulin-GFP (green), cells were treated with TAT-conjugated Cy3-labeled anti-ELKS antibody (red) for 50 min. Each circle (1 μm in diameter) in the green channel corresponds to the circle in the red channel. Solid circles represent the colocalization of insulin granules and ELKS clusters. Dotted circles indicate observed insulin granules, but not ELKS clusters. Dashed circles indicate insulin granules with only a partially corresponding overlap. Arrowed circles represent the insulin granules that eventually were fused by stimulation with 50 mM KCl (see the dual-colored movie in supplemental data). Box indicates the area in C. (C) Insulin granules underwent exocytosis at ELKS clusters. The box (1 × 1 μm) indicates the granule to be fused. Timestamp (minute:second:millisecond) was overlaid. Time 0 indicates the addition of KCl. (D) Sequential images (1 × 1 μm, 300-ms intervals) of a single insulin granule (green) at the ELKS cluster (red) during stimulation with 50 mM KCl.
Figure 8.
Figure 8.
Repeated fusion from insulin granules on the same site of ELKS cluster. (A) Dual imaging of GFP-tagged insulin granules and Cy3-labeleld ELKS clusters in living MIN6 cells. The box indicates the granule to be fused repeatedly. (B) Sequential images analysis boxed in A (1 × 1 μm, 300-ms intervals) of repeated fusion from GFP-tagged insulin granules (green) at the same Cy3-labeled ELKS cluster (red), during 50 mM KCl stimulation. Time 0 indicates the addition of KCl. The time of each frame in the sequence is indicated in seconds.
Figure 9.
Figure 9.
Interaction with ELKS and Bassoon. (A) In vitro binding studies of ternary complex formation of ELKS, Bassoon, and RIM2. Each expression plasmid of Myc-ELKS, HA-RIM2, or EGFP-Bassoon was transfected into HEK293 cells. Each protein was extracted and mixed, in the indicated combinations, followed by immunoprecipitation by using anti-GFP antibody (α GFP). Immunoprecipitates were then analyzed by immunoblotting by using the anti-GFP, anti-Myc, and anti-HA antibodies. IP, immunoprecipitation. (B) Coimmunoprecipitation assay in MIN6 cells. MIN6 cell lysates were immunoprecipitated with anti-Bassoon mAb or anti-Myc mAb (as a control). The immunoprecipitates were subjected to immunoblot analysis with anti-Bassoon mAb, anti-ELKS pAb, and anti-RIM2 pAb. Note that when Bassoon was immunoprecipitated by its antibody, ELKS and RIM2 were coimmunoprecipitated with Bassoon. (C) Colocalization of ELKS and Bassoon in the plasma membrane of MIN6 cells analyzed by TIRFM. Cells were fixed and double immunostained using anti-ELKS pAb and anti-Bassoon mAb, followed by secondary antibodies (Alexa Fluor-488–conjugated anti-rabbit and Alexa Fluor 546-conjugated antimouse antibodies). The colocalization of ELKS clusters (green) and Bassoon clusters (red) is demonstrated by the overlap (yellow) of green and red channel images.
Figure 10.
Figure 10.
TAT-ELKSBsnBD binds Bassoon (A) and inhibits the binding of ELKS and Bassoon. (A) Direct binding of TAT-ELKSBsnBD to Bassoon by pull-down assay. The GST fusion proteins containing Bassoon and Piccolo as well as GST alone were immobilized to glutathione-Sepharose beads. Myc-tagged TAT-ELKSBsnBD was then incubated with the beads. Proteins that bound to the beads were analyzed by immunoblotting by using anti-Myc mAb. Arrowheads indicate TAT-ELKSBsnBD. Note that TAT-ELKSBsnBD found GST-Bassoon and GST-Piccolo, but it did not bind GST alone. (B) Effects of TAT-ELKSBsnBD on the binding of ELKS and Bassoon. Immunoprecipitation assay of Myc-ELKS and EGFP-Bassoon was performed in the presence or absence of Myc-tagged TAT-ELKSBsnBD by using anti-GFP antibody, followed by immunoblotting by using the anti-Myc and anti-GFP antibodies. Note that the binding of ELKS and Bassoon was inhibited in the presence of TAT-ELKSBsnBD.
Figure 11.
Figure 11.
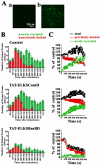
TAT-ELKSBsnBD inhibits both phases of insulin release. (A) Transduction of TAT-ELKSBsnBD into MIN6 cells. Control cells (a) and Myc-tagged TAT-ELKSBsnBD-treated (70 μg/ml for 50 min) cells (b) were fixed, immunostained for Myc, and deserved by confocal laser-scanning microscopy. (B) Analysis of fusion events of GFP-tagged insulin granules in control, TAT-ELKSContD-treated, and TAT-ELKSBsnBD–treated MIN6 cells by high-glucose (22 mM) stimulation with TIRFM. MIN6 cells expressing GFP-tagged insulin were treated with and/or without 70 μg/ml TAT fusion protein for 50 min, and TIRF images were acquired every 300 ms by 22 mM glucose stimulation. The fusion events (200 μm2) were manually counted as described in Materials and Methods. The histogram shows the number of fusion events (n = 6 cells) at 1-min intervals after high glucose (22 mM) stimulation in control and the TAT fusion protein-treated cells. The histogram is divided into two categories: fusion from previously docked granules (red column) and newly recruited docked granules (green column). Data are mean ± SEM. (C) Time-dependent change of the number of insulin granules docked to the plasma membrane. The number of previously docked granules (red line) and the number of newly recruited granules (green line) during 22 mM glucose stimulation were determined by counting granules on each sequential image (200 μm2,n = 3 cells each) in control and in TAT fusion protein-treated cells. Black line shows the total number of docked granules and corresponds to the sum of the red and green lines. Time 0 indicates the addition of high glucose (22 mM). The number of previously docked granules at time 0 was taken as 100% (46, 55, and 65 granules, respectively, in each of the control cells; 49, 59, and 57 granules, respectively, in each of the TAT-ELKSContD-treated cells; 52, 57, and 68 granules, respectively, in each of the TAT-ELKSBsnBD-treated cells). Data are mean ± SEM.
Figure 12.
Figure 12.
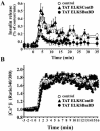
Effects of TAT-ELKSBsnBD on insulin release and on [Ca2+]i response to high glucose in MIN6 cells. (A) Insulin release from perifused control and the TAT fusion protein-treated (70 μg/ml for 50 min) cells stimulated with 22 mM glucose. The cells in the cell chamber (∼106 cells per chamber) were perifused with KRB (0.5 ml/min) at 37°C, and the perfusate was analyzed for IRI by radioimmunoassay. Results are given as a percentage of the cellular insulin content (2.9 μg/106 cells in control cells, 3.1 μg/106 cells in TAT-ELKSContD-treated cells, and 2.8 μg/106 cells in TAT-ELKSBsnBD–treated cells). (B) Glucose-induced changes in [Ca2+]i in control and the TAT fusion protein-treated (70 μg/ml for 50 min) cells. Glucose-induced changes in [Ca2+]i were measured in each treated cells by Fura-2 AM (5 μM). Time 0 indicates the time of the addition of high glucose. The fluorescence ratio (340/360) at time 0 was taken as 1.
Figure 13.
Figure 13.
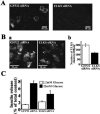
Silencing ELKS in MIN6 cells with RNAi. (A) ELKS siRNA suppressed expression of recombinant Myc-tagged ELKS in HEK293 cells. The expression vector encoding Myc-tagged ELKS and GFP-22 siRNA (as control) or ELKS siRNA were cotransfected into HEK293 cells. Two days after transfection, cells were fixed, permeabilized, and stained with anti-Myc mAb and Alexa Fluor-546–conjugated anti-mouse secondary antibody. The fluorescence image was analyzed by confocal laser scanning microscopy. Note that ELKS siRNA efficiently silenced the expression of Myc-tagged ELKS. (B) a, silencing of endogenous ELKS in MIN6 cells with siRNA caused reduction of number of ELKS clusters. GFP-22 siRNA (as control) or ELKS siRNA was transfected into MIN6 cells. At 3 d after transfection, cells were fixed, permeabilized, and stained with anti-ELKS pAb and Alexa Fluor-546–conjugated anti-rabbit secondary antibody. The fluorescence image was analyzed by TIRFM. Note that the number of ELKS clusters was markedly reduced on the plasma membrane of ELKS siRNA-transfected cells, compared with GFP-22 siRNA-transfected cells. b, number of ELKS clusters in the plasma membrane. The number of individual fluorescent spots of ELKS shown in TIRF images was counted. Data are mean ± SE for each transfected cell (n = 40 cells each). (C) Silencing of endogenous ELKS with siRNA caused a decrease of glucose-evoked insulin release from MIN6 cells. GFP-22 (control) or ELKS siRNA-transfected MIN6 cells were incubated for 15 min with basal low glucose (2.2 mM) or high glucose (22 mM). Data are mean ± SEM of eight determinations from individual wells.

Similar articles

Cited by

References

    1. Akimoto, Y., Kreppel, L. K., Hirano, H., and Hart, G. W. (1999). Localization of the O-linked N-acetylglucosamine transferase in rat pancreas. Diabetes 48, 2407–2413. - PubMed
    1. Altrock, W. D., et al. (2003). Functional inactivation of a fraction of excitatory synapses in mice deficient for the active zone protein bassoon. Neuron 37, 787–800. - PubMed
    1. Betz, A., Thakur, P., Junge, H. J., Ashery, U., Rhee, J. S., Scheuss, V., Rosenmund, C., Rettig, J., and Brose, N. (2001). Functional interaction of the active zone proteins Munc13–1 and RIM1 in synaptic vesicle priming. Neuron 30, 183–196. - PubMed
    1. Brose, N., Rosenmond, C., and Rettig, J. (2000). Regulation of transmitter release by Unc-13 and its homologues. Curr. Opin. Neurobiol. 10, 303–311. - PubMed
    1. Burns, M. E., and Augustine., G. J. (1995). Synaptic structure and function: dynamic organization yields architectural precision. Cell 83, 187–194. - PubMed

Publication types

MeSH terms