

The Nkx6.1 homeodomain transcription factor suppresses glucagon expression and regulates glucose-stimulated insulin secretion in islet beta cells
- PMID: 15883383
- PMCID: PMC1091752
- DOI: 10.1073/pnas.0502168102
The Nkx6.1 homeodomain transcription factor suppresses glucagon expression and regulates glucose-stimulated insulin secretion in islet beta cells
Abstract
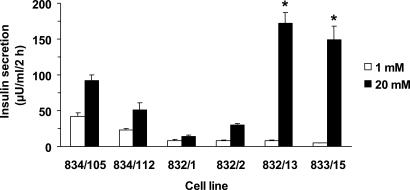
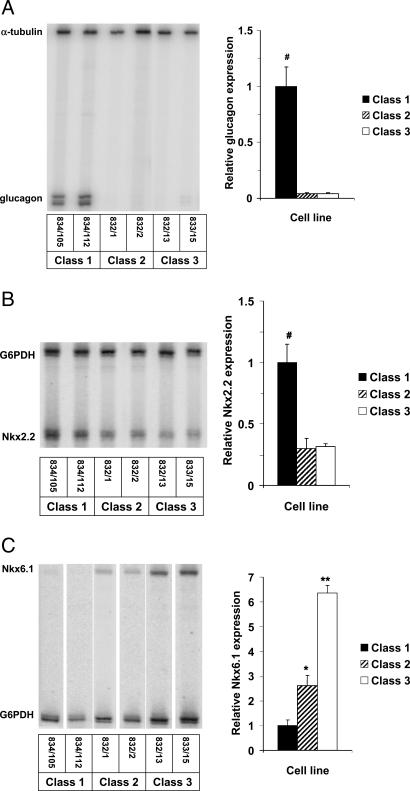
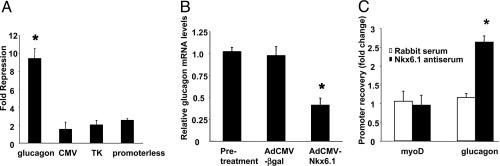
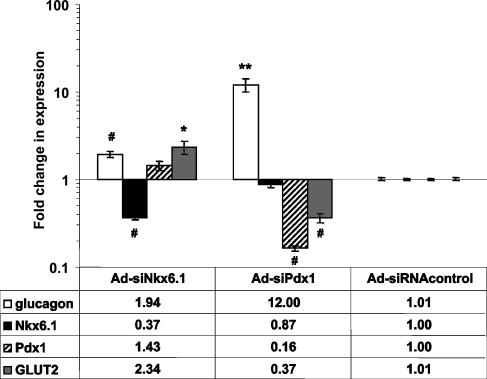
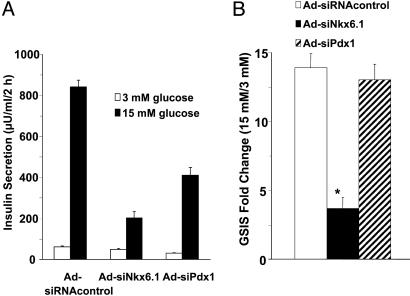
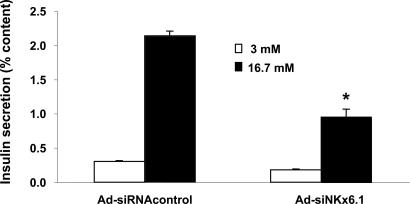
We have previously described rat insulinoma INS-1-derived cell lines with robust or poor glucose-stimulated insulin secretion (GSIS). In the current study, we have further resolved these lines into three classes: class 1, glucose-unresponsive/glucagon-expressing; class 2, glucose-unresponsive/glucagon-negative; and class 3, glucose-responsive/glucagon-negative. The transcription factor Nkx2.2 was expressed with relative abundance of 3.3, 1.0, and 1.0 in class 1, class 2, and class 3 cells, respectively, whereas Nkx6.1 expression had the opposite trend: 1.0, 2.6, and 6.4 in class 1, class 2, and class 3 cells, respectively. In class 1 cells, overexpressed Nkx6.1 suppressed glucagon expression but did not affect the levels of several other prominent beta cell transcription factors. RNA interference (RNAi)-mediated suppression of Nkx6.1 in class 3 cells resulted in a doubling of glucagon mRNA, with no effect on Pdx1 levels, whereas suppression of Pdx1 in class 3 cells caused a 12-fold increase in glucagon transcript levels, demonstrating independent effects of Nkx6.1 and Pdx1 on glucagon expression in beta cell lines. RNAi-mediated suppression of Nkx6.1 expression in class 3 cells also caused a decrease in GSIS from 13.9- to 3.7-fold, whereas suppression of Pdx1 reduced absolute amounts of insulin secretion without affecting fold response. Finally, RNAi-mediated suppression of Nkx6.1 mRNA in primary rat islets was accompanied by a significant decrease in GSIS relative to control cells. In sum, our studies have revealed roles for Nkx6.1 in suppression of glucagon expression and control of GSIS in islet beta cells.
Figures

Similar articles
-
Stimulation of human and rat islet beta-cell proliferation with retention of function by the homeodomain transcription factor Nkx6.1.Mol Cell Biol. 2008 May;28(10):3465-76. doi: 10.1128/MCB.01791-07. Epub 2008 Mar 17. Mol Cell Biol. 2008. PMID: 18347054 Free PMC article.
-
Glucose-regulated glucagon secretion requires insulin receptor expression in pancreatic alpha-cells.J Biol Chem. 2005 Sep 30;280(39):33487-96. doi: 10.1074/jbc.M506276200. Epub 2005 Jul 14. J Biol Chem. 2005. PMID: 16027126
-
IPF1/PDX1 deficiency and beta-cell dysfunction in Psammomys obesus, an animal With type 2 diabetes.Diabetes. 2001 Aug;50(8):1799-806. doi: 10.2337/diabetes.50.8.1799. Diabetes. 2001. PMID: 11473041
-
Glucagon-like peptide-1.Recent Prog Horm Res. 2001;56:377-99. doi: 10.1210/rp.56.1.377. Recent Prog Horm Res. 2001. PMID: 11237222 Review.
-
NKX6.1 transcription factor: a crucial regulator of pancreatic β cell development, identity, and proliferation.Stem Cell Res Ther. 2020 Oct 29;11(1):459. doi: 10.1186/s13287-020-01977-0. Stem Cell Res Ther. 2020. PMID: 33121533 Free PMC article. Review.
Cited by
-
A feat of metabolic proportions: Pdx1 orchestrates islet development and function in the maintenance of glucose homeostasis.Mol Genet Metab. 2007 Sep-Oct;92(1-2):43-55. doi: 10.1016/j.ymgme.2007.06.008. Epub 2007 Jul 30. Mol Genet Metab. 2007. PMID: 17659992 Free PMC article. Review.
-
Genome-wide linkage scans for type 2 diabetes mellitus in four ethnically diverse populations-significant evidence for linkage on chromosome 4q in African Americans: the Family Investigation of Nephropathy and Diabetes Research Group.Diabetes Metab Res Rev. 2009 Nov;25(8):740-7. doi: 10.1002/dmrr.1031. Diabetes Metab Res Rev. 2009. PMID: 19795399 Free PMC article.
-
Stimulation of human and rat islet beta-cell proliferation with retention of function by the homeodomain transcription factor Nkx6.1.Mol Cell Biol. 2008 May;28(10):3465-76. doi: 10.1128/MCB.01791-07. Epub 2008 Mar 17. Mol Cell Biol. 2008. PMID: 18347054 Free PMC article.
-
Cdk5r1 Overexpression Induces Primary β-Cell Proliferation.J Diabetes Res. 2016;2016:6375804. doi: 10.1155/2016/6375804. Epub 2015 Dec 14. J Diabetes Res. 2016. PMID: 26788519 Free PMC article.
-
Deficiency of transcription factor Nkx6.1 does not prevent insulin secretion in INS-1E cells.Sci Rep. 2023 Jan 13;13(1):683. doi: 10.1038/s41598-023-27985-7. Sci Rep. 2023. PMID: 36639413 Free PMC article.
References
-
- Shapiro, A. M., Lakey, J. R., Ryan, E. A., Korbutt, G. S., Toth, E., Warnock, G. L., Kneteman, N. M. & Rajotte, R. V. (2000) N. Engl. J. Med. 343, 230-238. - PubMed
-
- Lebovitz, H. E. (2004) in Diabetes Mellitus, eds. LeRoith, D., Taylor, S. I. & Olefsky, J. M. (Lippincott, Philadelphia), pp. 1107-1138.
-
- Hohmeier, H. E., Mulder, H., Chen, G., Henkel-Rieger, R., Prentki, M. & Newgard, C. B. (2000) Diabetes 49, 424-430. - PubMed
-
- Asfari, M., Janjic, D., Meda, P., Li, G., Halban, P. A. & Wollheim, C. B. (1992) Endocrinology 130, 167-178. - PubMed
-
- Chen, G., Hohmeier, H. E., Gasa, R., Tran, V. V. & Newgard, C. B. (2000) Diabetes 49, 562-570. - PubMed
Publication types
MeSH terms
Substances
Grants and funding
LinkOut - more resources
Full Text Sources
Other Literature Sources
Medical
Molecular Biology Databases
