Cell-cell interaction underlies formation of fluid in the male reproductive tract of the rat
- PMID: 15851503
- PMCID: PMC2217504
- DOI: 10.1085/jgp.200409205
Cell-cell interaction underlies formation of fluid in the male reproductive tract of the rat
Abstract
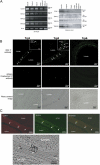
The epithelia lining the epididymides of many species consists of several cell types. We have provided evidence that the basal cells are essential to the integrated functions of the epithelium. Basal cells, but not principal cells, and other cells in the epididymis express TRPC3 and COX-1. We have isolated basal cells from intact rat epididymis using antibody-coated Dynabeads and subjected them to whole-cell patch-clamp measurement of nonselective cation channel activity, a feature of TRPC3 protein, and Fluo-3 fluorescence measurement of intracellular Ca2+ concentration. The results show that a nonselective cation current blockable by La3+ (0.1 mM), Gd3+ (0.1 mM), or SKF96365 (20 microM) could be activated by lysylbradykinin (200 nM). In cells loaded with Fluo-3, addition of lysylbradykinin (100 nM) caused a sustained increase of intracellular Ca2+. This effect was blocked by Gd3+ (0.1 mM) or SKF96365 (20 microM) and was not observed in Fluo-3-loaded principal cells. Stimulation of basal cell/principal cell cocultures with lysylbradykinin (200 nM) evoked in principal cells a current with CFTR-Cl- channel characteristics. Isolated principal cells in the absence of basal cells did not respond to lysylbradykinin but responded to PGE2 (100 nM) with activation of a CFTR-like current. Basal cells, but not principal cells, released prostaglandin E2 when stimulated with lysylbradykinin (100 nM). The release was blocked by SKF96365 (20 microM) and BAPTA-AM (0.05 or 0.1 mM). Confluent cell monolayers harvested from a mixture of disaggregated principal cells and basal cells responded to lysylbradykinin (100 nM) and PGE2 (500 nM) with an increase in electrogenic anion secretion. The former response was dependent on prostaglandin synthesis as piroxicam blocked the response. However, cell cultures obtained from principal cells alone responded to PGE2 but not to bradykinin. These results support the notion that basal cells regulate principal cells through a Ca2+ and COX signaling pathway.
Figures


Similar articles
-
COX-dependent and -independent pathways in bradykinin-induced anion secretion in rat epididymis.J Cell Physiol. 2002 May;191(2):217-26. doi: 10.1002/jcp.10086. J Cell Physiol. 2002. PMID: 12064465
-
Electrogenic anion secretion in cultured rat epididymal epithelium.J Physiol. 1986 Sep;378:335-45. doi: 10.1113/jphysiol.1986.sp016222. J Physiol. 1986. PMID: 3467065 Free PMC article.
-
Properties of cAMP-dependent and Ca(2+)-dependent whole cell Cl- conductances in rat epididymal cells.Am J Physiol. 1993 Apr;264(4 Pt 1):C794-802. doi: 10.1152/ajpcell.1993.264.4.C794. Am J Physiol. 1993. PMID: 7682772
-
Regulation of epididymal principal cell functions by basal cells: role of transient receptor potential (Trp) proteins and cyclooxygenase-1 (COX-1).Mol Cell Endocrinol. 2004 Mar 15;216(1-2):5-13. doi: 10.1016/j.mce.2003.10.077. Mol Cell Endocrinol. 2004. PMID: 15109739 Review.
-
Regulation of anion secretion by cyclo-oxygenase and prostanoids in cultured epididymal epithelia from the rat.J Physiol. 1999 Feb 1;514 ( Pt 3)(Pt 3):809-20. doi: 10.1111/j.1469-7793.1999.809ad.x. J Physiol. 1999. PMID: 9882752 Free PMC article.
Cited by
-
The significance of single-cell transcriptome analysis in epididymis research.Front Cell Dev Biol. 2024 Mar 21;12:1357370. doi: 10.3389/fcell.2024.1357370. eCollection 2024. Front Cell Dev Biol. 2024. PMID: 38577504 Free PMC article.
-
Effects of Heparan sulfate acetyl-CoA: Alpha-glucosaminide N-acetyltransferase (HGSNAT) inactivation on the structure and function of epithelial and immune cells of the testis and epididymis and sperm parameters in adult mice.PLoS One. 2023 Sep 27;18(9):e0292157. doi: 10.1371/journal.pone.0292157. eCollection 2023. PLoS One. 2023. PMID: 37756356 Free PMC article.
-
Epididymal epithelial degeneration and lipid metabolism impairment account for male infertility in occludin knockout mice.Front Endocrinol (Lausanne). 2022 Nov 28;13:1069319. doi: 10.3389/fendo.2022.1069319. eCollection 2022. Front Endocrinol (Lausanne). 2022. PMID: 36518247 Free PMC article.
-
Calcium Homeostasis in the Epididymal Microenvironment: Is Extracellular Calcium a Cofactor for Matrix Gla Protein-Dependent Scavenging Regulated by Vitamins.Front Cell Dev Biol. 2022 Feb 17;10:827940. doi: 10.3389/fcell.2022.827940. eCollection 2022. Front Cell Dev Biol. 2022. PMID: 35252193 Free PMC article. Review.
-
Morphology and immunolocalization of aquaporins 1 and 9 in the agouti (Dasyprocta azarae) testis excurrent ducts.Anim Reprod. 2021 Nov 4;18(3):e20210070. doi: 10.1590/1984-3143-AR2021-0070. eCollection 2021. Anim Reprod. 2021. PMID: 34840612 Free PMC article.
References
-
- Chan, H.C., and P.Y.D. Wong. 1996. The epididymis epithelial cells. Epithelial Cells. A. Harris, editor. Cambridge University Press, Cambridge. 79–86.
-
- Cheuk, B.L., W.H. Ko, and P.Y.D. Wong. 2002. COX-dependent and -independent pathways in bradykinin-induced anion secretion in rat epididymis. J. Cell. Physiol. 191:217–226. - PubMed
-
- Cheung, K.H., C.T. Leung, G.P.H. Leung, and P.Y.D. Wong. 2003. Synergistic effects of cystic fibrosis transmembrane conductance regulator and aquaporin-9 in the rat epididymis. Biol. Reprod. 68:1505–1510. - PubMed
-
- Chow, B.K.C., K.H. Cheung, E.M.W. Tsang, M.C.T. Leung, S.M.Y. Lee, and P.Y.D. Wong. 2004. Secretin controls anion secretion in the rat epididymis in an autocrine/paracrine fashion. Biol. Reprod. 70:1594–1599. - PubMed
-
- Clapham, D.E., L.W. Runnels, and C. Strubing. 2001. The TRP ion channel family. Nat. Rev. Neurosci. 2:387–396. - PubMed
Publication types
MeSH terms
Substances
LinkOut - more resources
Full Text Sources
Miscellaneous

