

Delayed, asynchronous, and reversible T-lineage specification induced by Notch/Delta signaling
- PMID: 15833919
- PMCID: PMC1080135
- DOI: 10.1101/gad.1298305
Delayed, asynchronous, and reversible T-lineage specification induced by Notch/Delta signaling
Abstract
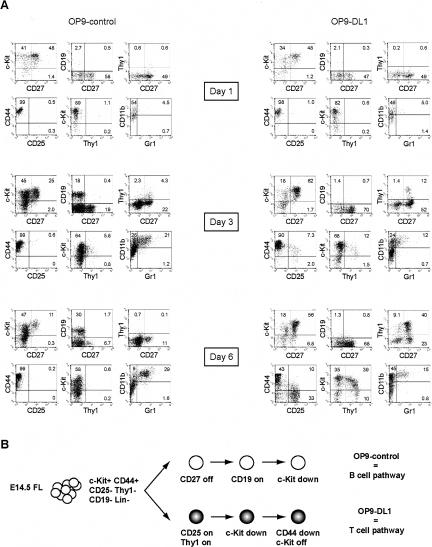
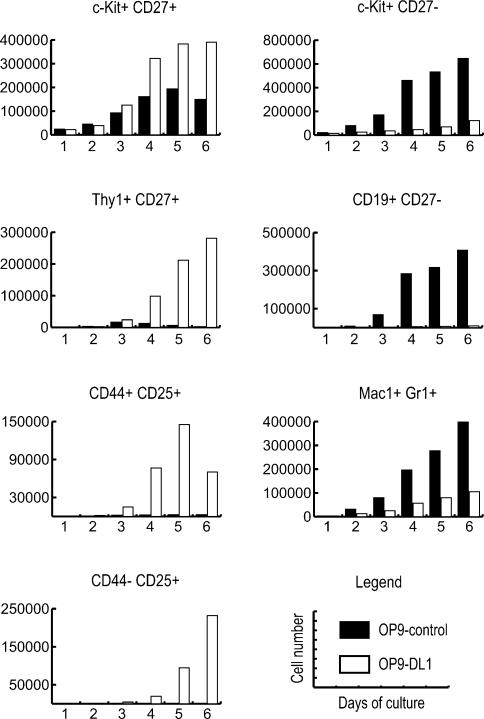
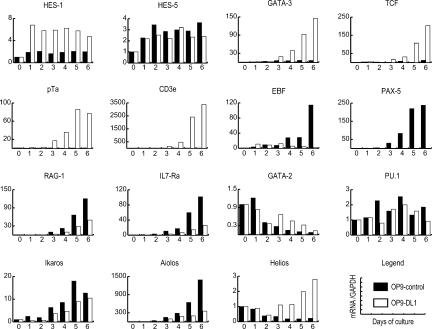
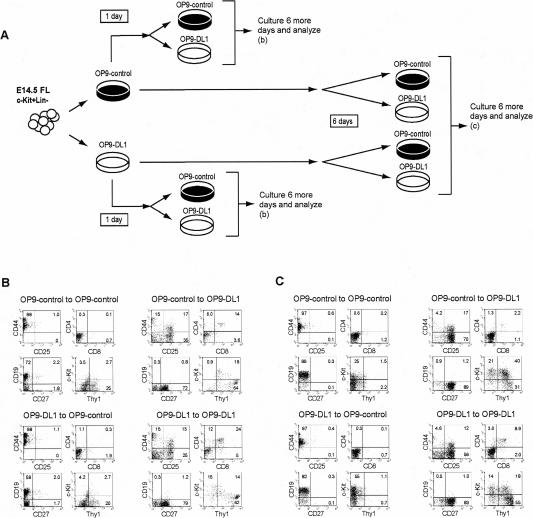
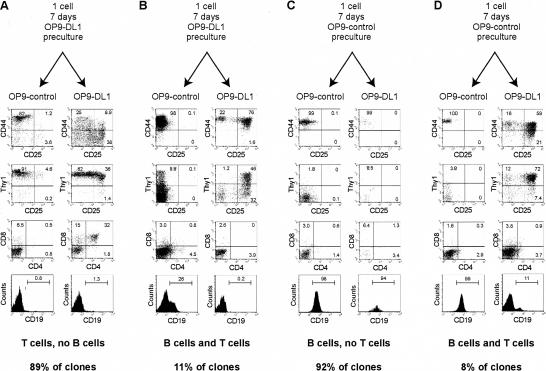
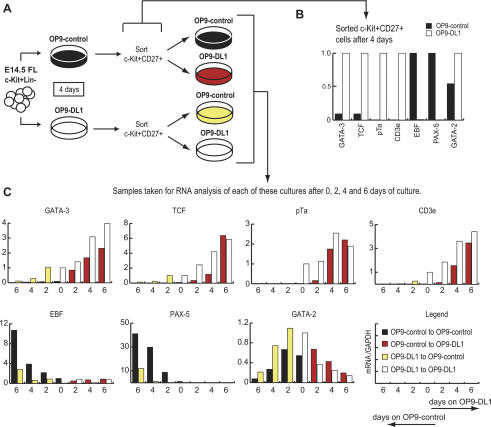
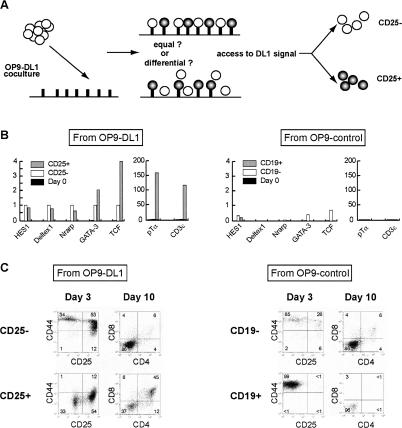
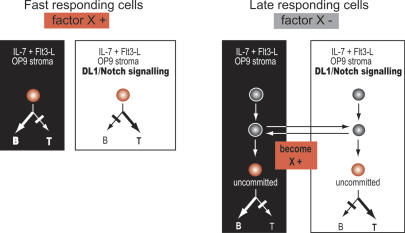
Using the OP9-DL1 system to deliver temporally controlled Notch/Delta signaling, we show that pluripotent hematolymphoid progenitors undergo T-lineage specification and B-lineage inhibition in response to Notch signaling in a delayed and asynchronous way. Highly enriched progenitors from fetal liver require > or =3 d to begin B- or T-lineage differentiation. Clonal switch-culture analysis shows that progeny of some single cells can still generate both B- and T-lineage cells, after 1 wk of continuous delivery or deprivation of Notch/Delta signaling. Notch signaling induces T-cell genes and represses B-cell genes, but kinetics of activation of lineage-specific transcription factors are significantly delayed after induction of Notch target genes and can be temporally uncoupled from the Notch response. In the cells that initiate T-cell differentiation and gene expression most slowly in response to Notch/Delta signaling, Notch target genes are induced to the same level as in the cells that respond most rapidly. Early lineage-specific gene expression is also rapidly reversible in switch cultures. Thus, while necessary to induce and sustain T-cell development, Notch/Delta signaling is not sufficient for T-lineage specification and commitment, but instead can be permissive for the maintenance and proliferation of uncommitted progenitors that are omitted in binary-choice models.
Figures
Similar articles
-
Hierarchy of Notch-Delta interactions promoting T cell lineage commitment and maturation.J Exp Med. 2007 Feb 19;204(2):331-43. doi: 10.1084/jem.20061442. Epub 2007 Jan 29. J Exp Med. 2007. PMID: 17261636 Free PMC article.
-
Direct comparison of Dll1- and Dll4-mediated Notch activation levels shows differential lymphomyeloid lineage commitment outcomes.J Immunol. 2010 Jul 15;185(2):867-76. doi: 10.4049/jimmunol.1000782. Epub 2010 Jun 14. J Immunol. 2010. PMID: 20548034
-
Maintenance of T cell specification and differentiation requires recurrent notch receptor-ligand interactions.J Exp Med. 2004 Aug 16;200(4):469-79. doi: 10.1084/jem.20040394. J Exp Med. 2004. PMID: 15314075 Free PMC article.
-
Negotiation of the T lineage fate decision by transcription-factor interplay and microenvironmental signals.Immunity. 2007 Jun;26(6):690-702. doi: 10.1016/j.immuni.2007.06.005. Immunity. 2007. PMID: 17582342 Review.
-
Stepwise specification of lymphocyte developmental lineages.Curr Opin Genet Dev. 2000 Aug;10(4):370-9. doi: 10.1016/s0959-437x(00)00098-8. Curr Opin Genet Dev. 2000. PMID: 10889068 Review.
Cited by
-
TNF-alpha and Notch signaling regulates the expression of HOXB4 and GATA3 during early T lymphopoiesis.In Vitro Cell Dev Biol Anim. 2016 Oct;52(9):920-934. doi: 10.1007/s11626-016-0055-8. Epub 2016 Jun 1. In Vitro Cell Dev Biol Anim. 2016. PMID: 27251160
-
Positive feedback between PU.1 and the cell cycle controls myeloid differentiation.Science. 2013 Aug 9;341(6146):670-3. doi: 10.1126/science.1240831. Epub 2013 Jul 18. Science. 2013. PMID: 23868921 Free PMC article.
-
Single-cell deletion analyses show control of pro-T cell developmental speed and pathways by Tcf7, Spi1, Gata3, Bcl11a, Erg, and Bcl11b.Sci Immunol. 2022 May 20;7(71):eabm1920. doi: 10.1126/sciimmunol.abm1920. Epub 2022 May 20. Sci Immunol. 2022. PMID: 35594339 Free PMC article.
-
Delta-like 4 is indispensable in thymic environment specific for T cell development.J Exp Med. 2008 Oct 27;205(11):2507-13. doi: 10.1084/jem.20080134. Epub 2008 Sep 29. J Exp Med. 2008. PMID: 18824583 Free PMC article.
-
Sustained Notch signaling in progenitors is required for sequential emergence of distinct cell lineages during organogenesis.Genes Dev. 2006 Oct 1;20(19):2739-53. doi: 10.1101/gad.1444706. Genes Dev. 2006. PMID: 17015435 Free PMC article.
References
-
- Allman D., Sambandam, A., Kim, S., Miller, J.P., Pagan, A., Well, D., Meraz, A., and Bhandoola, A. 2003. Thymopoiesis independent of common lymphoid progenitors. Nat. Immunol. 4: 168-174. - PubMed
-
- Anderson G., Pongracz, J., Parnell, S., and Jenkinson, E.J. 2001. Notch ligand-bearing thymic epithelial cells initiate and sustain Notch signaling in thymocytes independently of T cell receptor signaling. Eur. J. Immunol. 31: 3349-3354. - PubMed
-
- Anderson M.K., Hernandez-Hoyos, G., Dionne, C.J., Arias, A.M., Chen, D., and Rothenberg, E.V. 2002. Definition of regulatory network elements for T cell development by perturbation analysis with PU.1 and GATA-3. Dev. Biol. 246: 103-121. - PubMed
-
- Anderson M.K., Pant, R., Miracle, A.L., Sun, X., Luer, C.A., Walsh, C.J., Telfer, J.C., Litman, G.W., and Rothenberg, E.V. 2004. Evolutionary origins of lymphocytes: Ensembles of T cell and B cell transcriptional regulators in a cartilaginous fish. J. Immunol. 172: 5851-5860. - PubMed
-
- Artavanis-Tsakonas S., Rand, M.D., and Lake, R.J. 1999. Notch signaling: Cell fate control and signal integration in development. Science 284: 770-776. - PubMed
Publication types
MeSH terms
Substances
Grants and funding
LinkOut - more resources
Full Text Sources
Other Literature Sources
Medical