Synthetic prions generated in vitro are similar to a newly identified subpopulation of PrPSc from sporadic Creutzfeldt-Jakob Disease
- PMID: 15802644
- PMCID: PMC2253268
- DOI: 10.1110/ps.041186605
Synthetic prions generated in vitro are similar to a newly identified subpopulation of PrPSc from sporadic Creutzfeldt-Jakob Disease
Abstract
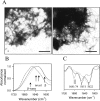
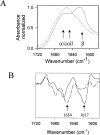
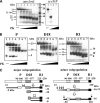
In recent studies, the amyloid form of recombinant prion protein (PrP) encompassing residues 89-230 (rPrP 89-230) produced in vitro induced transmissible prion disease in mice. These studies showed that unlike "classical" PrP(Sc) produced in vivo, the amyloid fibrils generated in vitro were more proteinase-K sensitive. Here we demonstrate that the amyloid form contains a proteinase K-resistant core composed only of residues 152/153-230 and 162-230. The PK-resistant fragments of the amyloid form are similar to those observed upon PK digestion of a minor subpopulation of PrP(Sc) recently identified in patients with sporadic Creutzfeldt-Jakob disease (CJD). Remarkably, this core is sufficient for self-propagating activity in vitro and preserves a beta-sheet-rich fibrillar structure. Full-length recombinant PrP 23-230, however, generates two subpopulations of amyloid in vitro: One is similar to the minor subpopulation of PrP(Sc), and the other to classical PrP(Sc). Since no cellular factors or templates were used for generation of the amyloid fibrils in vitro, we speculate that formation of the subpopulation of PrP(Sc) with a short PK-resistant C-terminal region reflects an intrinsic property of PrP rather than the influence of cellular environments and/or cofactors. Our work significantly increases our understanding of the biochemical nature of prion infectious agents and provides a fundamental insight into the mechanisms of prions biogenesis.
Figures


Similar articles
-
In vitro conversion of full-length mammalian prion protein produces amyloid form with physical properties of PrP(Sc).J Mol Biol. 2005 Feb 18;346(2):645-59. doi: 10.1016/j.jmb.2004.11.068. Epub 2004 Dec 19. J Mol Biol. 2005. PMID: 15670611
-
Gerstmann-Sträussler-Scheinker disease and "anchorless prion protein" mice share prion conformational properties diverging from sporadic Creutzfeldt-Jakob disease.J Biol Chem. 2014 Feb 21;289(8):4870-81. doi: 10.1074/jbc.M113.531335. Epub 2014 Jan 7. J Biol Chem. 2014. PMID: 24398683 Free PMC article.
-
Identification of novel proteinase K-resistant C-terminal fragments of PrP in Creutzfeldt-Jakob disease.J Biol Chem. 2003 Oct 17;278(42):40429-36. doi: 10.1074/jbc.M308550200. Epub 2003 Aug 12. J Biol Chem. 2003. PMID: 12917418
-
Biochemical Characterization of Prions.Prog Mol Biol Transl Sci. 2017;150:389-407. doi: 10.1016/bs.pmbts.2017.06.012. Epub 2017 Aug 8. Prog Mol Biol Transl Sci. 2017. PMID: 28838671 Review.
-
On the biology of prions.Acta Neuropathol. 1987;72(4):299-314. doi: 10.1007/BF00687261. Acta Neuropathol. 1987. PMID: 3554880 Review.
Cited by
-
Genesis of mammalian prions: from non-infectious amyloid fibrils to a transmissible prion disease.PLoS Pathog. 2011 Dec;7(12):e1002419. doi: 10.1371/journal.ppat.1002419. Epub 2011 Dec 1. PLoS Pathog. 2011. PMID: 22144901 Free PMC article.
-
The dominant-negative effect of the Q218K variant of the prion protein does not require protein X.Protein Sci. 2007 Oct;16(10):2166-73. doi: 10.1110/ps.072954607. Epub 2007 Aug 31. Protein Sci. 2007. PMID: 17766375 Free PMC article.
-
Distinct stability states of disease-associated human prion protein identified by conformation-dependent immunoassay.J Virol. 2010 Nov;84(22):12030-8. doi: 10.1128/JVI.01057-10. Epub 2010 Sep 15. J Virol. 2010. PMID: 20844046 Free PMC article.
-
Conserved amyloid core structure of stop mutants of the human prion protein.Prion. 2013 May-Jun;7(3):193-7. doi: 10.4161/pri.23956. Epub 2013 Feb 13. Prion. 2013. PMID: 23406905 Free PMC article.
-
Amyloid features and neuronal toxicity of mature prion fibrils are highly sensitive to high pressure.J Biol Chem. 2011 Apr 15;286(15):13448-59. doi: 10.1074/jbc.M110.192872. Epub 2011 Feb 25. J Biol Chem. 2011. PMID: 21357423 Free PMC article.
References
-
- Adler, V., Zeiler, B., Kryukov, V., Kascsak, R., Rubenstein, R., and Grossman, A. 2003. Small, highly structured RNAs participate in the conversion of human recombinant PrPsen to PrPres in vitro. J. Mol. Biol. 332 47–57. - PubMed
-
- Barron, R.M., Thomson, V., King, D., Shaw, J., Melton, D.W., and Manson, J.C. 2003. Transmission of murine scrapie to P101L transgenic mice. J. Gen. Virol. 84 3165–3172. - PubMed
-
- Baskakov, I.V. 2004. Autocatalytic conversion of recombinant prion proteins displays a species barrier. J. Biol. Chem. 279 586–595. - PubMed
Publication types
MeSH terms
Substances
Grants and funding
- BBS/E/I/00000973/BB_/Biotechnology and Biological Sciences Research Council/United Kingdom
- BBS/E/I/00000877/BB_/Biotechnology and Biological Sciences Research Council/United Kingdom
- AG022116/AG/NIA NIH HHS/United States
- R01 NS045585/NS/NINDS NIH HHS/United States
- NS045585/NS/NINDS NIH HHS/United States
LinkOut - more resources
Full Text Sources
Other Literature Sources
Medical
Research Materials

